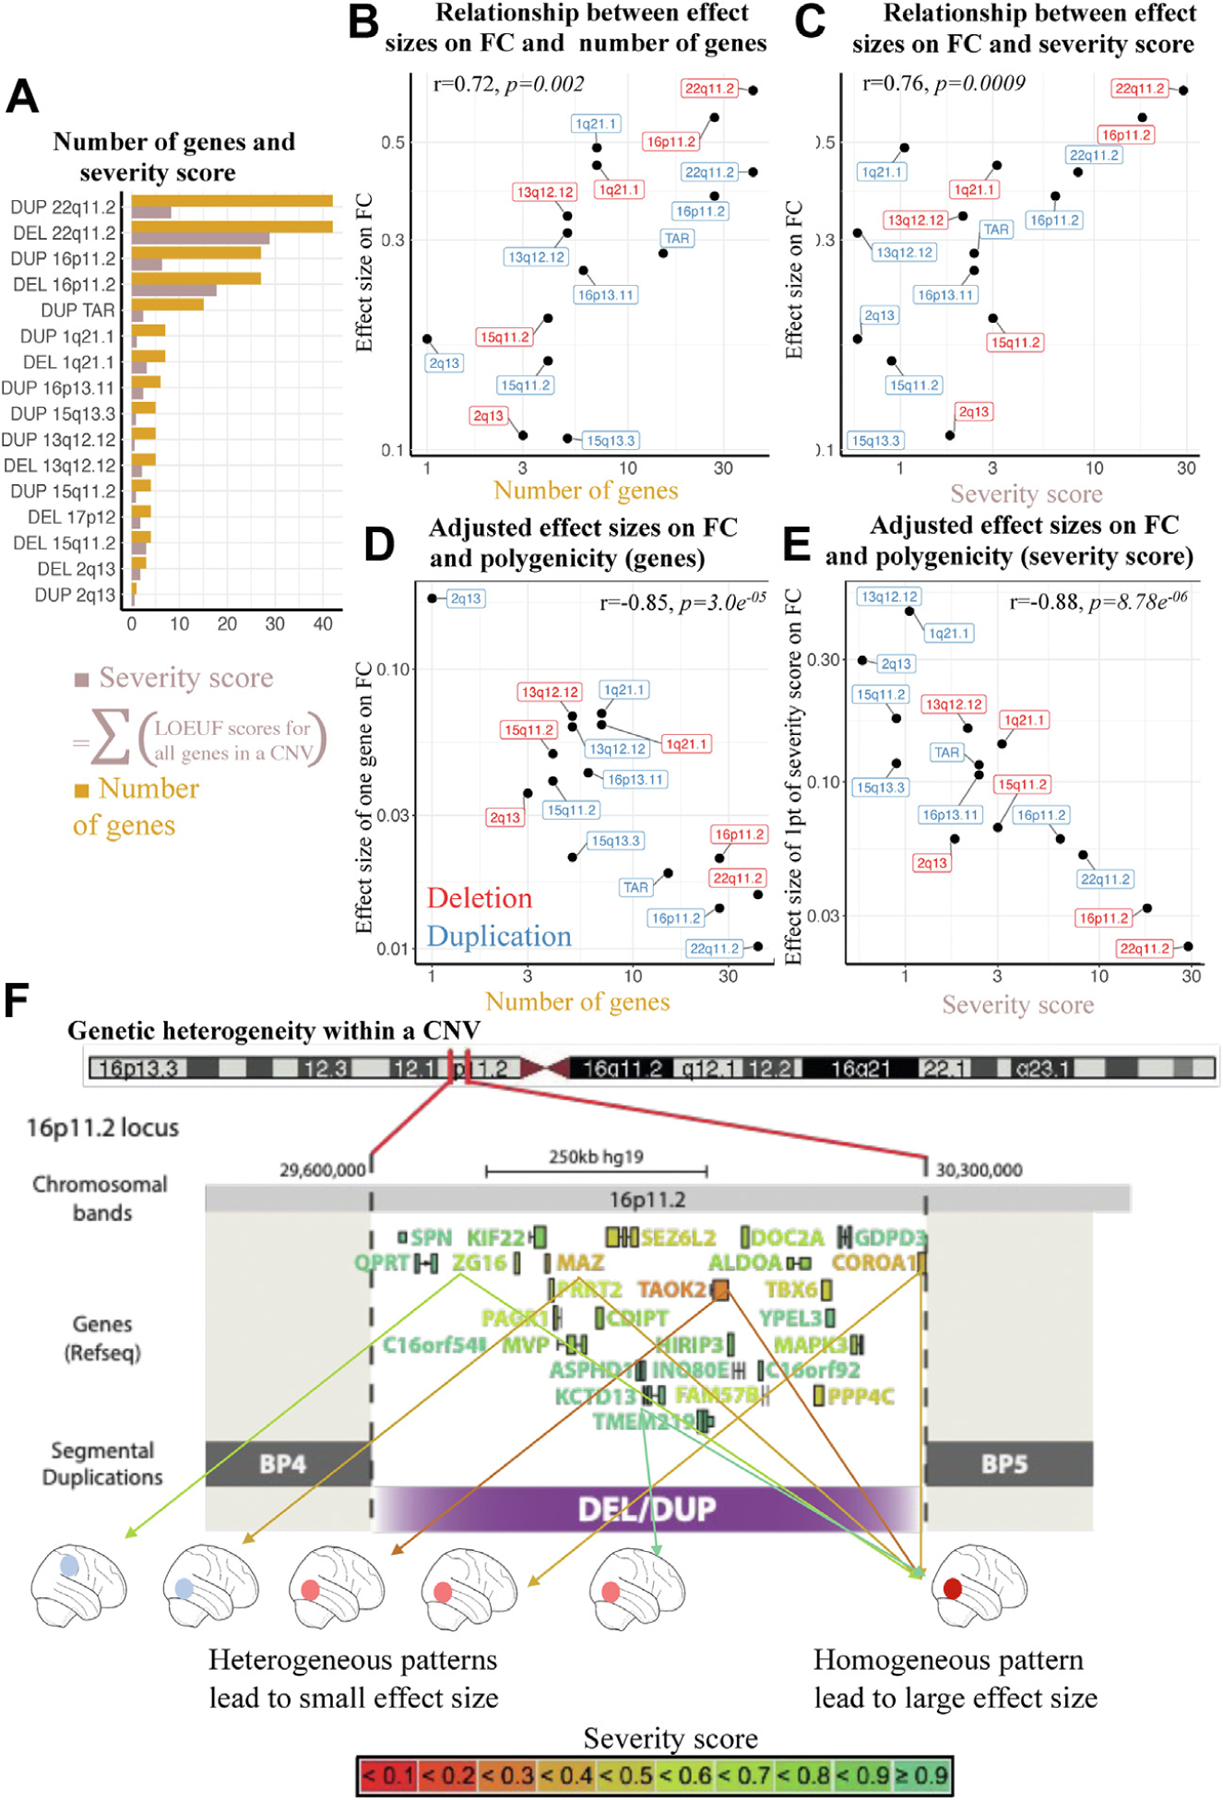
Figure 4.

Relation between multigenicity and connectivity. (A) Number of genes and severity score. Bar plot showing for each CNV, the number of genes encompassed, and the sum of genes weighted by their intolerance score (sum of 1/LOEUF). The sum of 1/LOEUF values of all genes encompassed in a CNV is highly predictive of the effect size of CNVs on cognitive ability. (B) Relation between effect sizes on FC and number of genes. The y-axis indicates effect size of CNVs on FC. The x-axis indicates number of genes in each CNV. (C) Relation between effect sizes on FC and severity score. The y-axis indicates effect size of CNVs on FC. The x-axis indicates severity score for each CNV. (D) Adjusted effect sizes on FC and multigenicity (genes). The y-axis indicates mean effect of 1 gene on FC (CNV effect sizes on FC adjusted for number of genes). The x-axis indicates number of genes in each CNV. (E) Adjusted effect sizes on FC and multigenicity (severity score). The y-axis indicates mean effect on FC of one point of severity score (CNV effect sizes adjusted by the severity score). The x-axis indicates severity score for each CNV. (F) Genetic heterogeneity within a CNV. Genes encompassed in the 16p11.2 CNV are color-coded based on their LOEUF score. Two scenarios are represented. Right, genes converge on shared brain patterns: the effect size of the CNV increases linearly with the number of intolerant genes and is large. Left, genes within a CNV are associated with distinct patterns: the resulting effect size is weaker. BP, breakpoint; CNV, copy number variant; DEL, deletion; DUP, duplication; FC, functional connectivity; LOEUF, loss of function observed/expected upper bound fraction; PRS, polygenic risk score.
