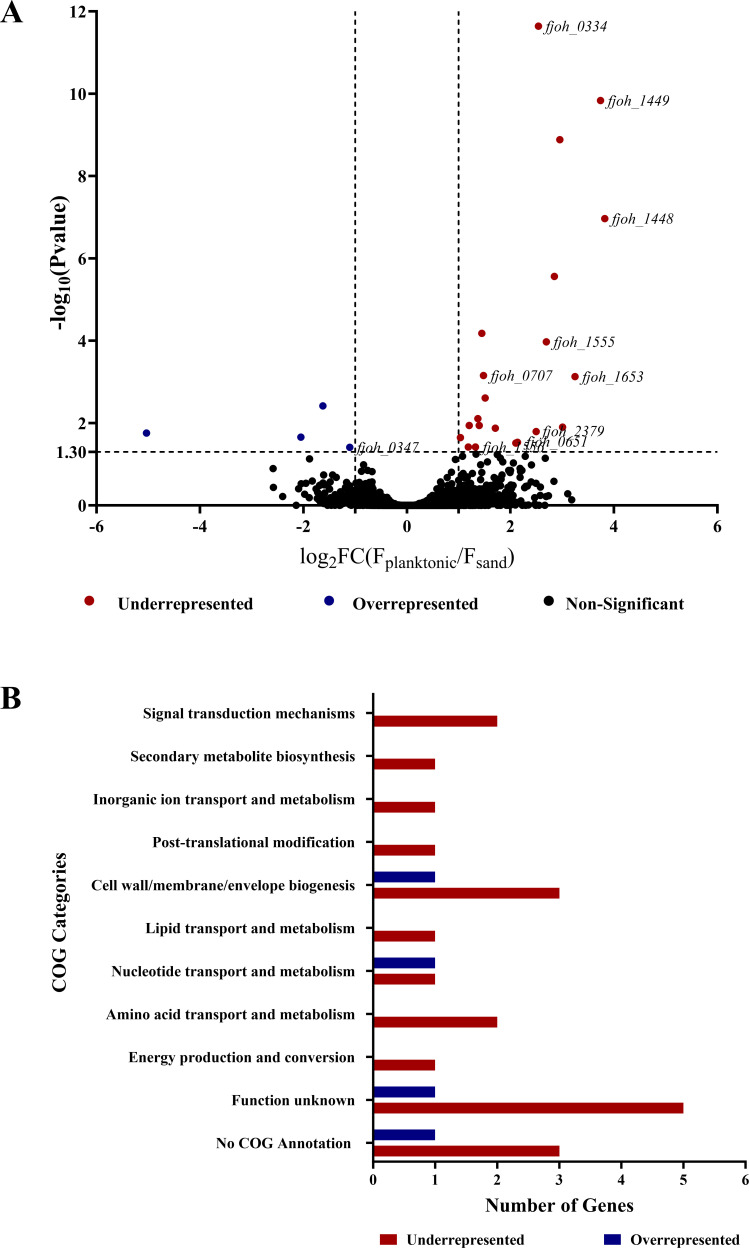
Fig 1.
Genes identified by INSeq screen as important for sand colonization. (A) The relative abundance of transposon insertions for each gene was compared between F. johnsoniae grown planktonically and on the sand. The data are presented as a volcano plot with –log10 P-value on the y-axis and log2 fold change (input/output) on the x-axis. The black dots represent mutants whose representation did not differ between conditions (P-value > 0.05), the red represents mutants that are significantly underrepresented on the surface of the sand, and the blue represents mutants that are significantly overrepresented on the surface of the sand (P-value < 0.05 and FC > 1 or FC < −1). The genes affected in mutants whose representation differed between the two conditions were validated by gene deletions; these mutants are labeled by their Gene ID. (B) The genes identified as important in sand colonization are categorized based on Clusters of Orthologous Genes (COG) annotation.

