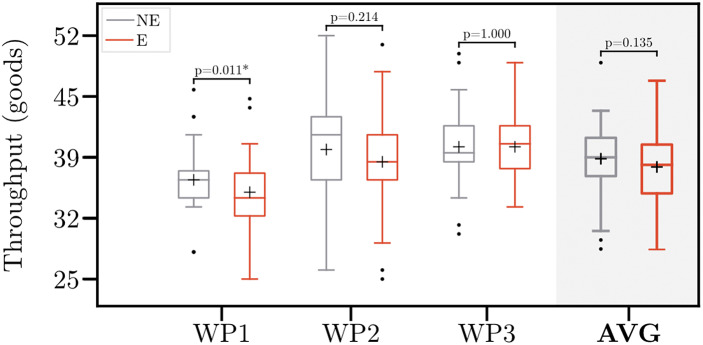
Figure 6.
Throughput without (NE) and with (E) the exoskeleton. Boxplots comprise data of 30 participants. Whiskers are set to 1.5
 IQR (interquartile range). Points indicate the outliers. Crosses indicate the mean throughput. Asterisk indicates the significant difference (p < .05). WP1–3, Workplace 1–3; AVG, averaged throughput across all workplaces.

