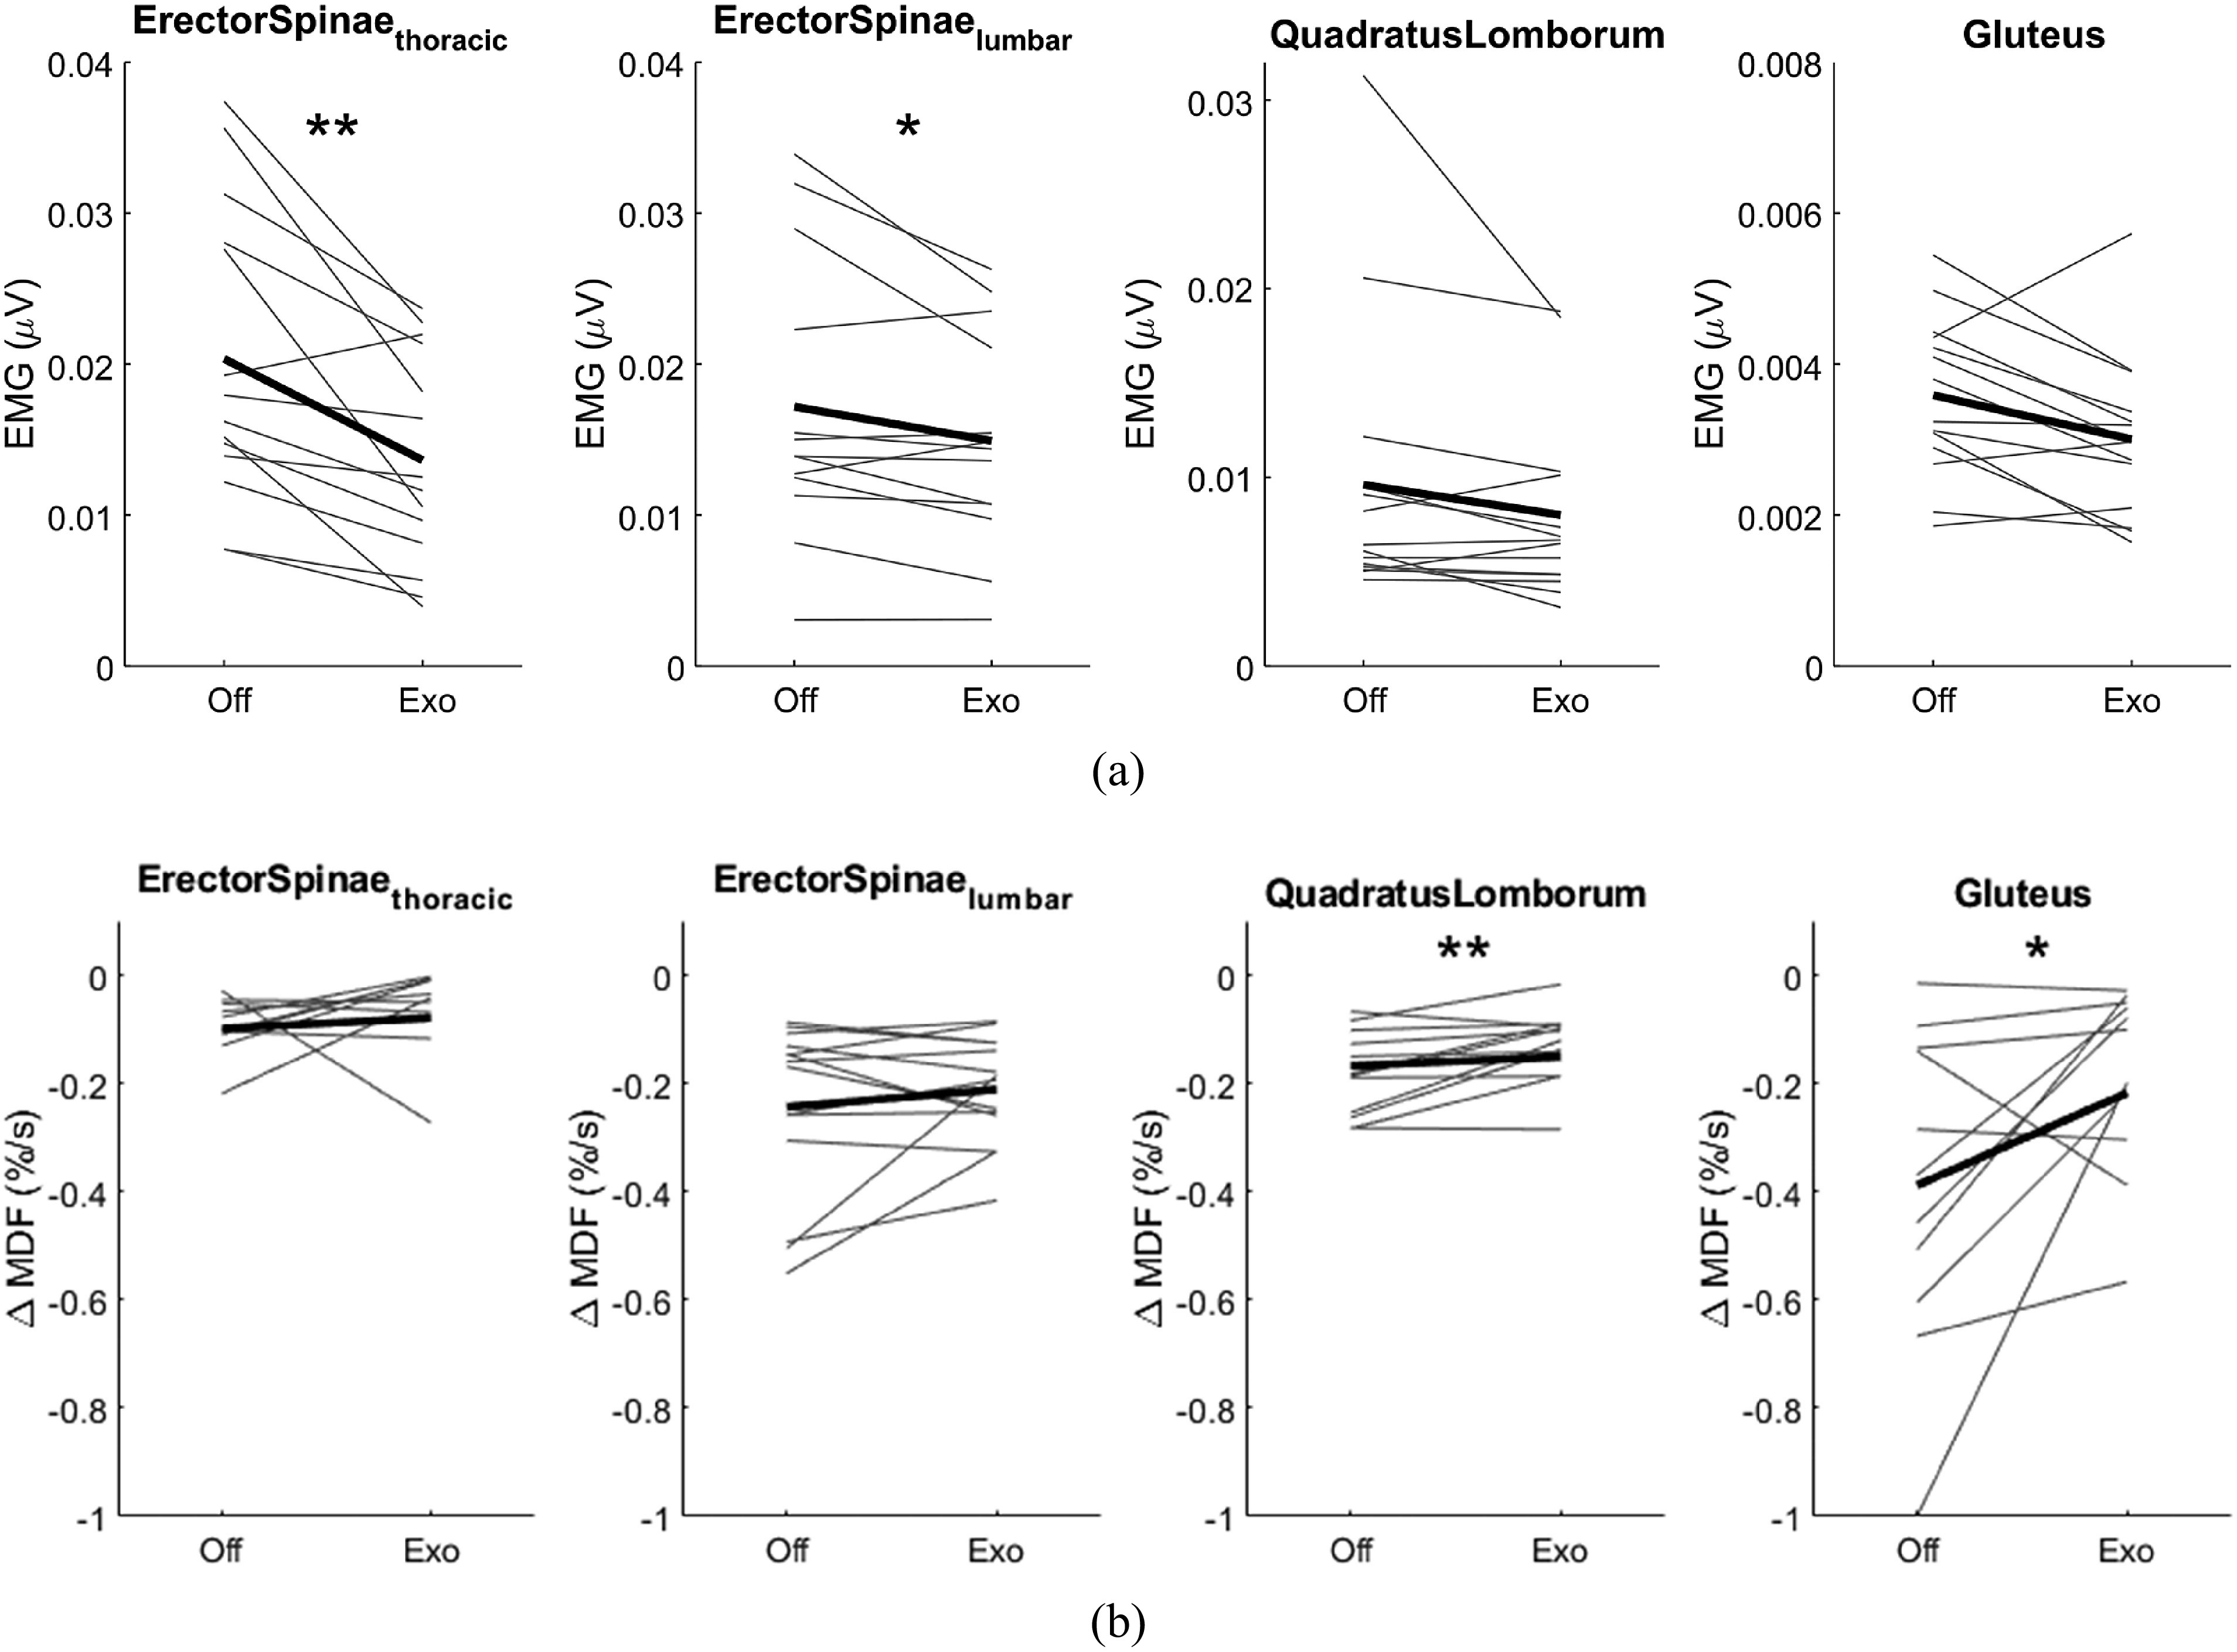
Figure 3.

(a) Root mean square of the muscle activity of each muscle group. (b) Slope of the change in median frequency over time for each muscle group. Individual participants (grey lines), as well as the sample average (n = 14, black line), are plotted. Stars indicate statistically significant differences based on paired samples t-test analysis: *p < .05, **p < .01.
