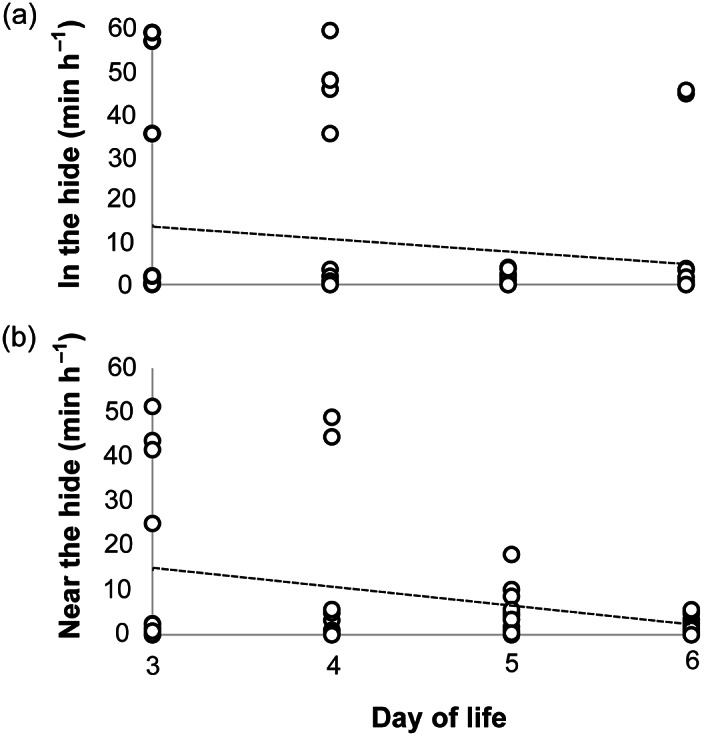
Figure 2.

The time that each calf (n = 14 in ‘hide’ treatment) spent (a) inside the hide (at least half the body was inside the hide) and (b) near the hide (calf was within one calf length of the hide) on days three to six of life during the 60-min period of temporary separation from the dam. Circles represent individual calves, and dotted lines represent the trendline for each dataset.
