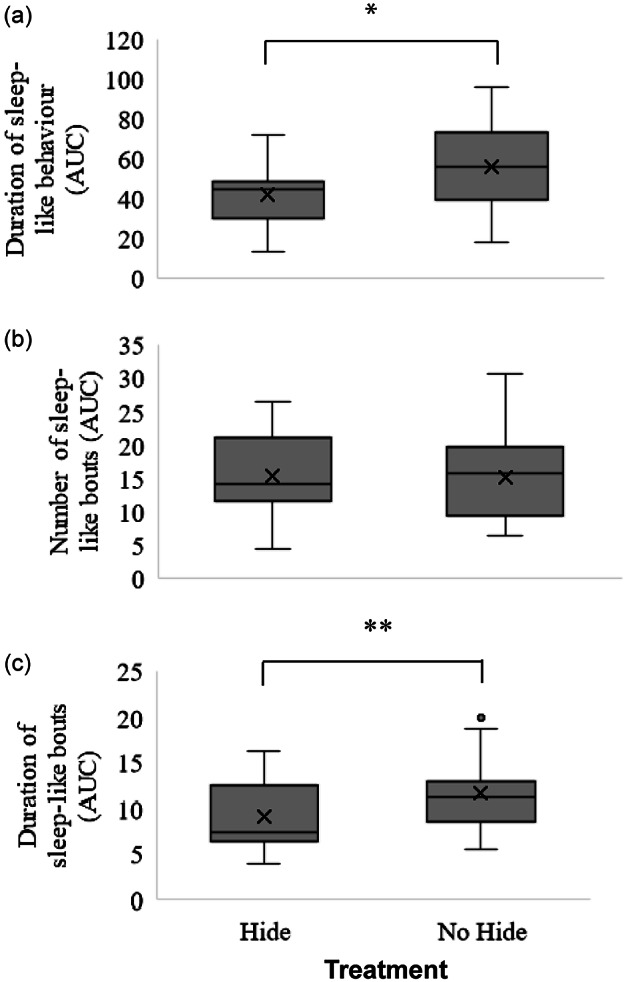
Figure 4.

The distribution of the area under the curve (AUC) for (a) the duration of sleep-like behaviours, (b) the number of sleep-like bouts, and (c) the duration of sleep-like bouts for dairy calves given a hiding place (hide) or not (no hide) during the 60-min period of temporary separation from the dam on days three to six of life. Upper and lower box limits represent the first and third quartiles. The black line within each box represents the median, and the x represents the mean. Whiskers extend to the lowest and highest values that are not outliers (values that are 1.5× the interquartile range). Circle outside of the whiskers indicates an outlier. ** Variables that show tendency to differ between treatments (0.05 ≥ P ≤ 0.1). * Variables that differ between treatments (P < 0.05).
