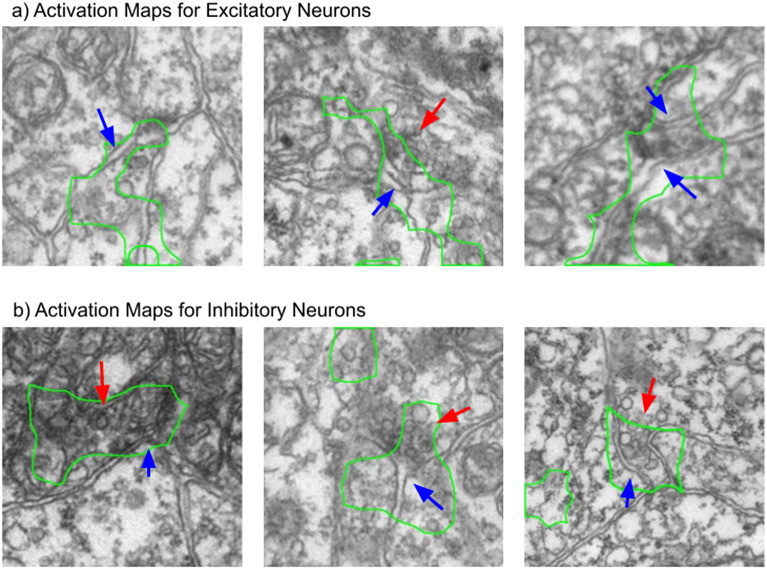
Figure 5.
Processed class activation maps for excitatory and inhibitory synapse image patches. The network seems to pay more attention to the vesicles when predicting inhibitory neurons, and the cell boundary when predicting excitatory neurons. The blue arrows indicate cell boundaries, whereas the red arrows indicate vesicles. The green outline shows the main region of interest of the network.

