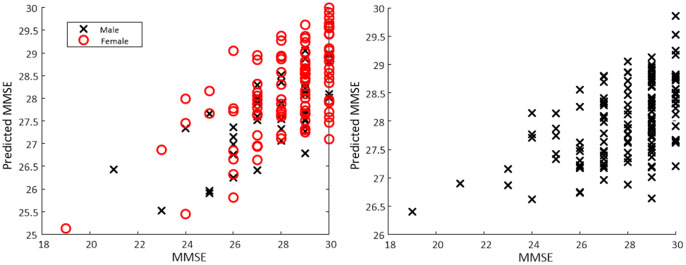
Figure 4.
Scatter plot of actual MMSE versus predicted MMSE based on a regression model obtained from a torso-mounted IMU during the FTSS. For the separate male/female models (left panel) mean R2 was 0.28 with mean RMSE of 1.62. For the all data model (right panel) R2 of 0.31 and RMSE of 1.60 was observed.

