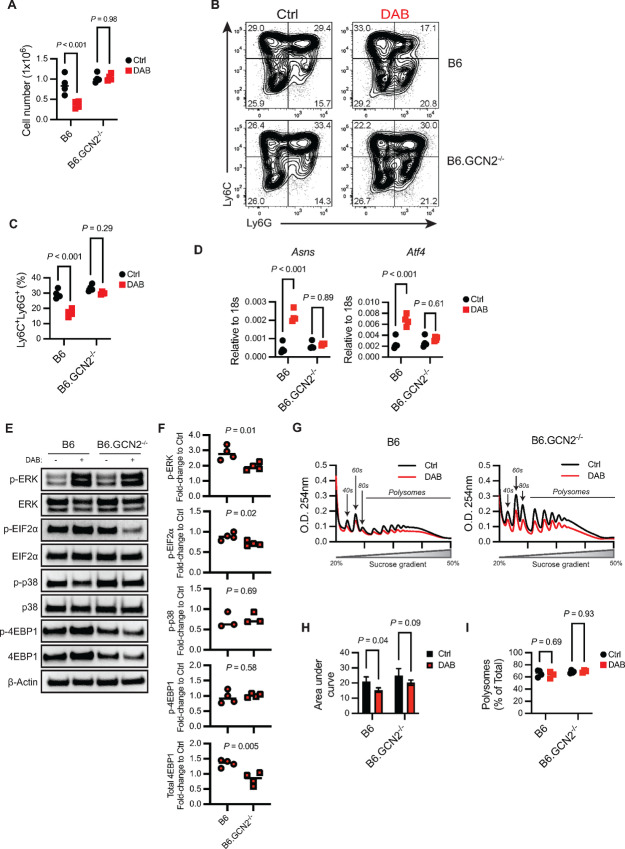
FIGURE 4.
Dabrafenib-induced GCN2 activation alters proliferation and differentiation of MDSCs. A, Total cell counts in MDSC in vitro cultures from wild-type (B6) and GCN2-deficient (B6.GCN2−/−) mice differentiated in presence of ± 1.5 µmol/L DAB. P values were determined by two-way ANOVA with Šidák correction post-test. Significance considered P < 0.05. B, Representative flow cytometry contour plot of Ly6C and Ly6G expression in wild-type and GCN2−/− MDSCs differentiated in presence of ± 1.5 µmol/L DAB. C, Frequency of CD11b+MHCIInegLy6C+Ly6G+ MDSCs in wild-type and GCN2−/− MDSCs differentiated in presence of ± 1.5 µmol/L DAB. P values were determined by two-way ANOVA with Šidák correction post-test. Significance considered P < 0.05. D, qPCR of Asns and Atf4 in MDSCs lysates in wild-type and GCN2−/− MDSCs differentiated in presence of ± 1.5 µmol/L DAB, relative to 18s mRNA. P value was determined by two-tailed unpaired Student t test. Significance considered P < 0.05. Western blot analysis (E) and densitometry quantification (F) of ERK1/2, eIF2α, p38, and 4EBP1 phosphorylation relative to total protein in whole culture MDSC lysates. Quantification is shown as fold change in the intensity signal of samples treated with 1.5 µmol/L DAB compared with Ctrl sample for each genotype (wild-type or GCN2−/−). P value was determined by two-tailed unpaired Student t test. Significance considered P < 0.05. G–I, Ribosomal profiling analyzed in wild-type and GCN2−/− MDSC lysates. G, Optical density (O.D.) at 254 nm. The area designated as “polysomes” represents the fraction of RNA-forming complexes of two or more ribosomes. H, AUC of the region marked as polysomes in G. Bars indicate mean ± SD (n = 4). P values were determined by two-way ANOVA with Šidák correction post-test. Significance considered P < 0.05. I, Relative quantification (%) of the AUC in polysomes versus monosomes (40s, 60s, and 80s region). Data are expressed as mean ± SD (n = 4). P values were determined by two-way ANOVA with Šidák correction post-test. Significance considered P < 0.05. For all panels, experiments were repeated three times with similar results. DAB = dabrafenib.

