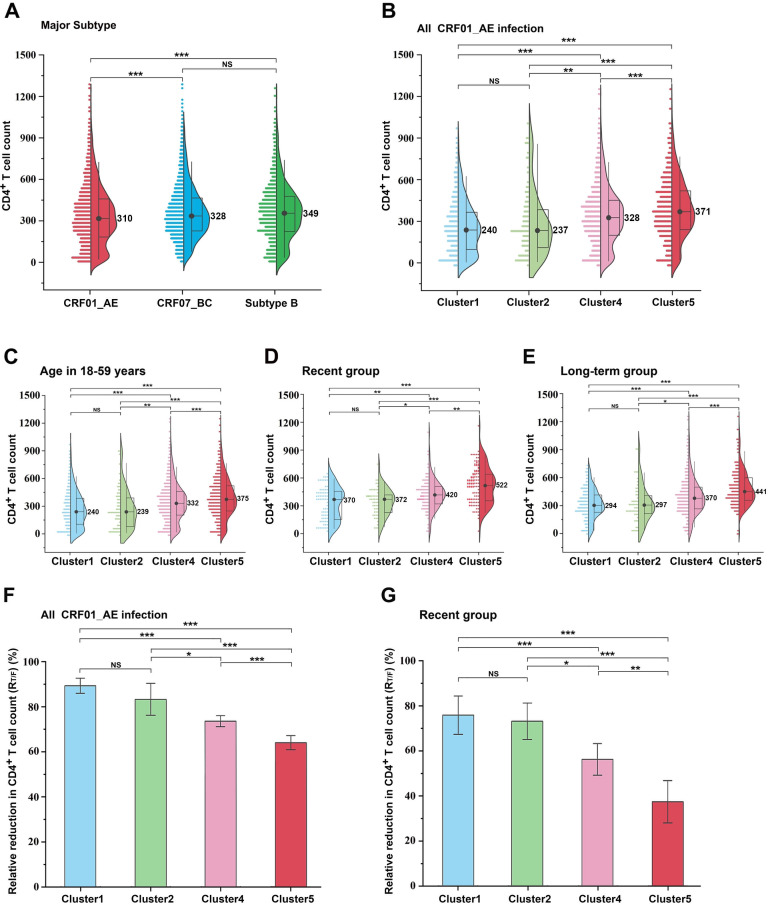
Fig 1.
Comparative evaluation of baseline CD4+ T cells and their reduction in HIV-1 sub-types and CRF01_AE clusters. (A) Differences in CD4+ T-cell count were assessed across serum samples from individuals infected with CRF01_AE (n = 2,683), CRF07_BC (n = 3,347), and sub-type B (n = 1,166) based on data from the National HIV Molecular Epidemiology Survey. (B) Comparison of CD4+ T-cell counts among different CRF01_AE clusters, including cluster 1 (n = 469), cluster 2 (n = 131), cluster 4 (n = 1,174), and cluste r5 (n = 773). (C) Comparison of CD4+ T-cell counts among different CRF01_AE clusters based on individuals in the age group of 18–59 years. (D) Comparison of CD4+ T-cell counts among different CRF01_AE clusters in the recent infection group. (E) Comparison of CD4+ T-cell counts among different CRF01_AE clusters in the long-term infection group. (F and G) Relative reduction in CD4+ T-cell counts among different CRF01_AE clusters. The middle bars, box, and whiskers indicate the median, interquartile range, and the 5th–95th percentiles, respectively. The non-parametric two-tailed Mann-Whitney U test was used to determine statistical differences in CD4+ T-cell count. The t-test was used to determine the mean RT/F difference in CRF01_AE clusters. *P < 0.05, **P < 0.01, ***P < 0.001. NS, not statistically significant.

