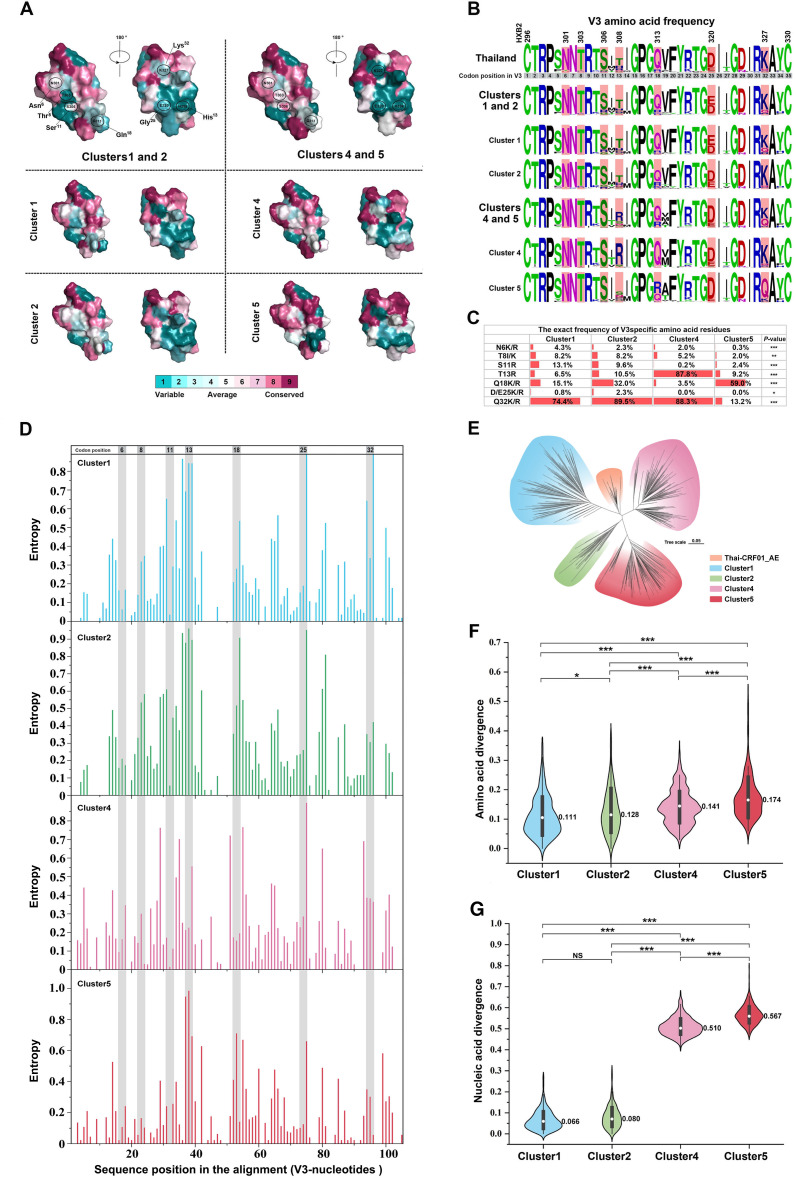
Fig 5.
Conserved amino acid sites in the V3 region on the surface of the CRF01_AE clusters. (A) Surface depiction of conserved V3 amino acid residues in clusters 1 (n = 521), 2 (n = 249), 4 (n = 597), and 5 (n = 341), colored from variable (teal) to conserved (fuchsia) as determined by Consurf analysis based on the available sequences (NHMES). The color gradient represents the level of sequence conservation determined based on the Consurf database. (B) Frequency of amino acids at key V3 positions related to the CXCR4-using phenotype in each cluster. Sequences from Thailand (n = 93) were obtained from the Los Alamos HIV sequence database (prior to the year 1999). (C)The exact frequencies are provided at the bottom. Differences in proportions or rates between clusters 1, 2 , 4, and 5 are assessed using the Cochran-Armitage trend test. (D) ENTROPY calculates the entropy of each position in an input sequence set. It is used to measure the relative variability of different positions or regions within the V3 loop gene of each cluster. The vertical axis signifies entropy scores, delineating the level of variability, while the horizontal axis denotes the position of amino acids within the env-V3 gene. (E) Based on a phylogenetic analysis of distinct clusters in China and early-stage CRF01_AE sub-type in Thailand (prior to the year 1999), an unrooted phylogenetic tree was constructed using sequences from the env C2-C4 region. (F and G) Nucleic acid and amino acid divergence in the V3 region for clusters 1, 2, 4 and 5 compared to the Thailand consensus sequence (generated from 93 sequences). Statistical significance is determined by one-way analysis of variance. *P < 0.05, **P < 0.01, ***P < 0.001. NS, not statistically significant.

