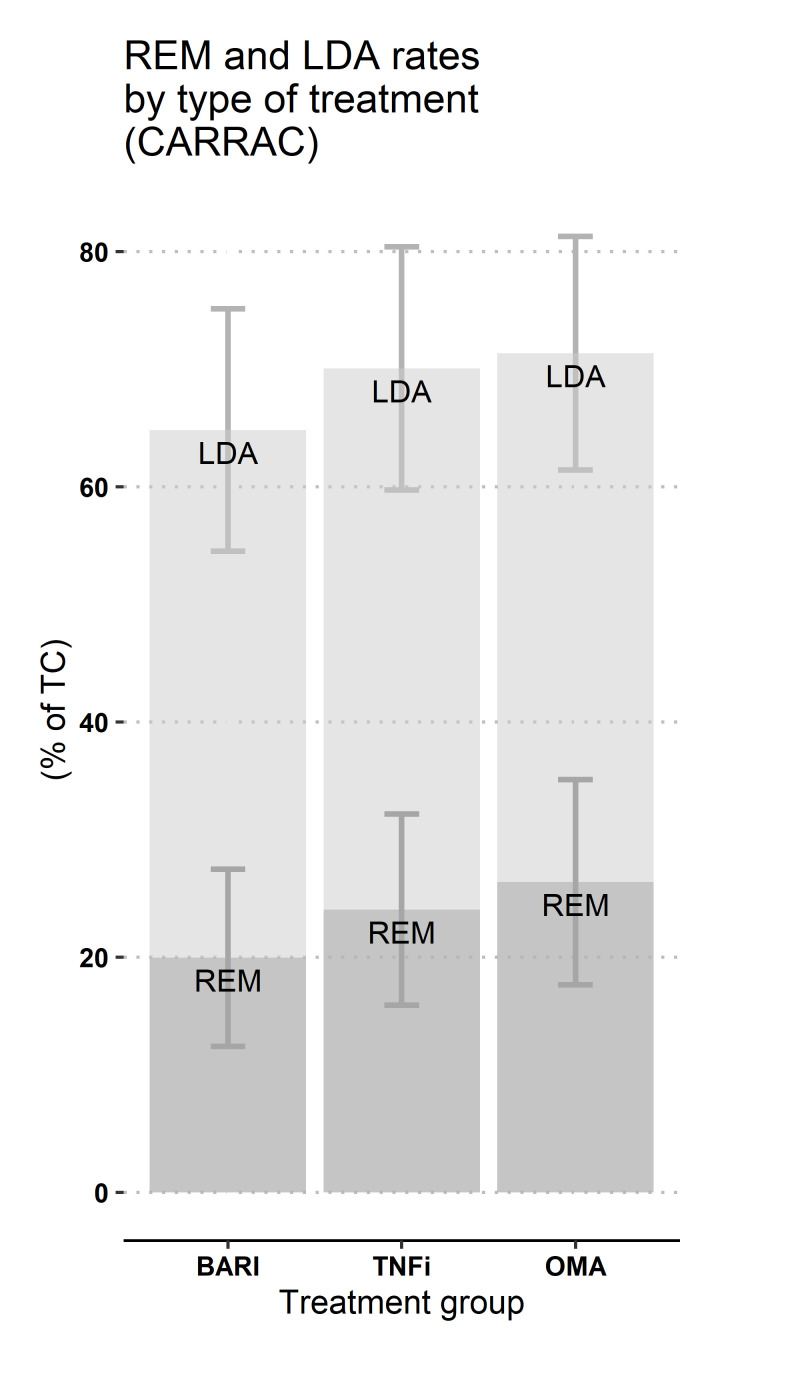
Figure 4.
Estimated response rates at 12 months (CARRAC), Swiss Clinical Quality Management registry, 2017–2020. BARI, baricitinib; LDA, low disease activity (ie, CDAI score ≤ 10), in light grey; CARRAC, confounder-adjusted response rate with attrition correction; OMA, other modes of action bDMARDs; REM, remission (ie, CDAI score ≤ 2.8), in dark grey; TNFi, tumour necrosis factor inhibitors. 95% CI, are represented. This method does not allow computing p values. Nb: two estimates were obtained in the BARI group and averaged to display only one representative value on the plot. Actual row output was 68% (95%CI 55% to 80%) (BARI vs TNFi model) or 62% (95% CI, 54 to 70) (BARI vs OMA model) for LDA and 23% (95% CI, 14 to 31) (BARI vs TNFi model) or 17% (95% CI, 10 to 24) (BARI vs OMA model) for REM.

