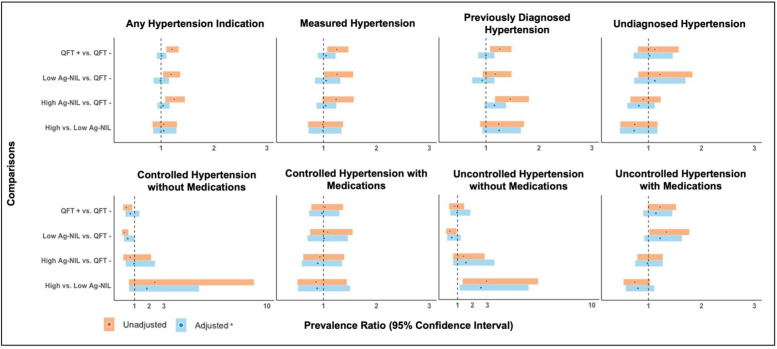
Figure 2.
Crude and adjusted associations between QuantiFERON-TB Gold In-Tube results (QFT) and select hypertension measures among US adults, NHANES 2011–2012. *Models were adjusted for age and gender. Circles in this panel of figures indicate point estimates from the robust Poisson models, expressed as prevalence ratios with the coloured bands indicating the accompanying 95% CIs. The vertical dashed line on the x-axis value of 1 marks the study null value (ie, β estimates=0 or prevalence ratio=1.00), suggesting no association. The top panel figures were produced from analyses performed among eligible participants (n=4989). The lower panel figures were produced from analyses performed among a subset of participants with known hypertension indication (n=1711). Ag-Nil, antigen tube minus the Nil tube; NHANES, National Health and Nutrition Examination Survey; TB, tuberculosis.

