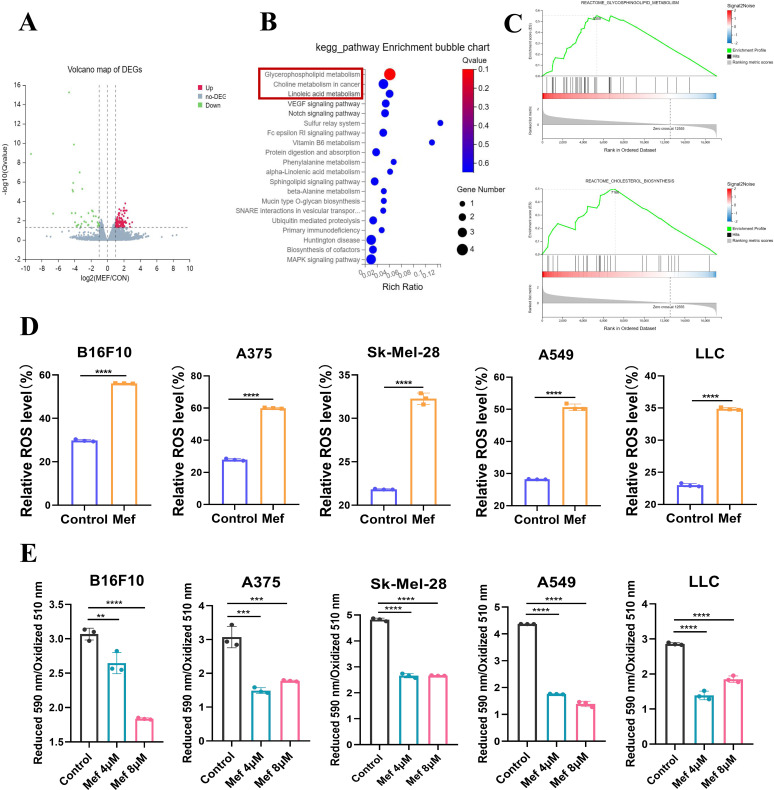
Figure 2.
Mefloquine upregulates the expression of lipid metabolism-related signaling molecules in tumor cells. (A) The volcano plot shows the DEGs after Mef treatment. (B) KEGG enrichment analysis was performed to determine the signaling pathways that were enriched in upregulated DEGs in tumor tissues after Mef treatment. (C) GSEA enrichment analysis was performed to determine the signaling pathways that were enriched in upregulated DEGs in tumor tissues after Mef treatment. (D) Flow cytometric analysis of relative DCFH-DA fluorescence was performed to measure ROS levels in melanoma and lung cancer cells treated with Mef (4 µM) for 6 hours (n=3 replicate cultures for each cell type). (E) Flow cytometric analysis of relative BODIPY 581/591 C11 fluorescence was performed to measure lipid peroxidation levels in melanoma and lung cancer cells treated with Mef for 2 hours. (n=3 replicate cultures for each cell type). All the data are presented as the mean (±SD). A t-test was used for comparisons between two groups. One-way analysis of variance was performed for comparisons among multiple groups. Statistical significance was assessed according to statistical methods (*p<0.05; **p<0.01; and ***p<0.001). DEG,Differentially Expressed Genes; GSEA, Gene Set Enrichment Analysis; KEGG, Kyoto Encyclopedia of Genes and Genomes; LLC, Lewis lung cancer; Mef, mefloquine; ROS, Reactive oxygen species.

