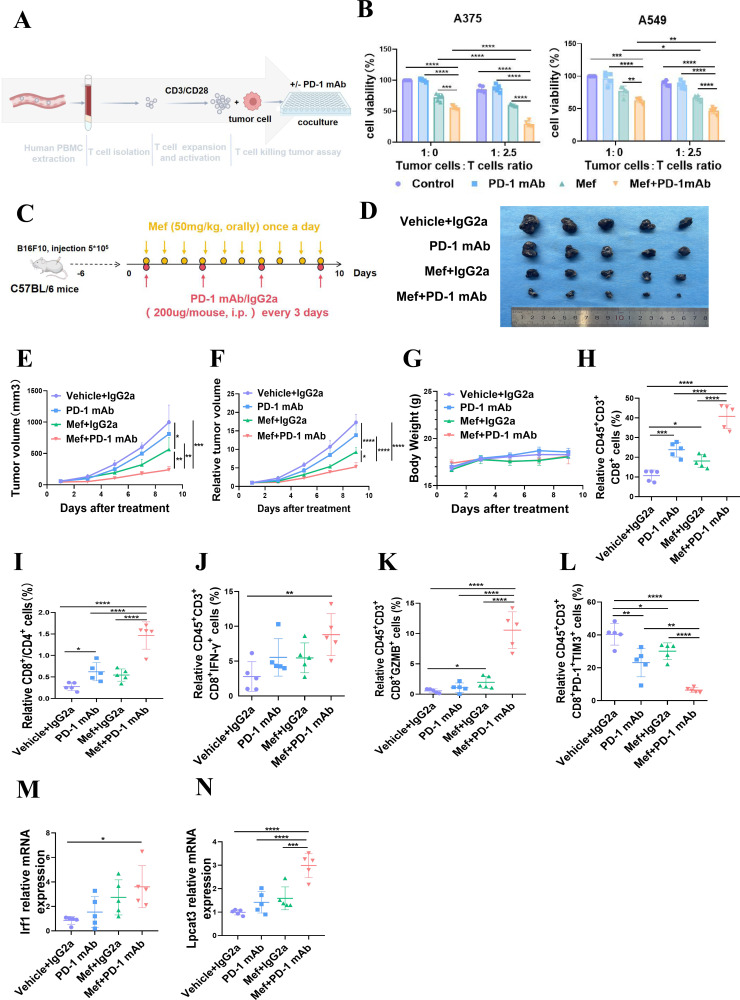
Figure 6.
Mefloquine enhances the efficacy of anti-PD-1 immunotherapy. (A) A schematic diagram of in vitro assays in which immune cells kill tumor cells is shown. (B) The killing of tumor cells by different proportions of patient-derived T cells treated with or without anti-PD-1 (10 ng/mL) for 48 hours was evaluated. (C) The schematic diagram shows the treatment of melanoma with Mef combined with PD-1 mAb. (D–G) B16F10 tumor-bearing C57BL/6 mice were treated with Mef (50 mg/kg, orally, daily) or IGg2a/anti-PD-1 mAb (200 µg/mouse, i.p. injection, every 3 days) to evaluate the effects on tumor volume and weight (n=5). (H–L) The Percentages of CD8+CD3+CD45+ T cells (H) CD8+/CD4+ T cells (I) IFN-γ+CD8+CD3+CD45+ T cells (J) GZMB+CD8+CD3+CD45+ T cells (K) and PD-1+TIM3+CD8+CD3+CD45+ T cells (L) in B16F10 tumors were determined (n=5). (M–N) The relative mRNA expression levels of lysophosphatidylcholine acyltransferase 3 (M) and IRF1 (N) in B16F10 tumors were determined (n=5). All the data are presented as the mean (±SD). One-way analysis of variance was performed for comparisons among multiple groups. Statistical significance was assessed according to statistical methods (*p<0.05; **p<0.01; and ***p<0.001). i.p., intraperitoneal; IFN, interferon; Mef, mefloquine; mAb, monoclonal antibody; mRNA, messenger RNA; PBMCs, peripheral blood mononuclear cells; PD-1, programmed cell death 1.

