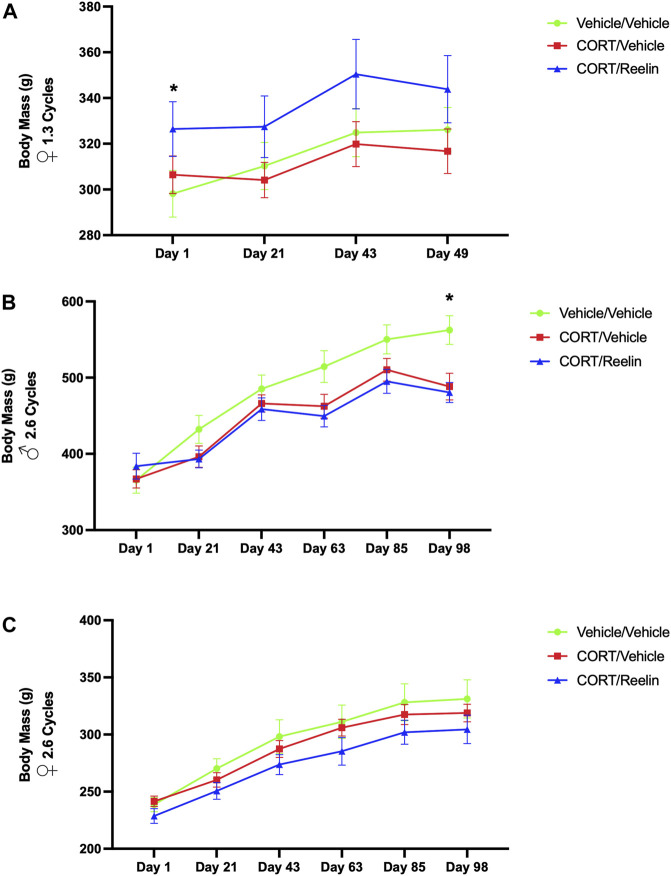
FIGURE 2.
Body mass for 1.3 cycles and 2.6 cycles showing minimal loss of body mass in the cyclic CORT model. (A) Body mass of females exposed to 1.3 cycles of CORT with no evidence of weight loss with CORT treatment. The CR group weighed more than the VV group at the start of the experiment despite a random group assignment. (B) Body mass for males exposed to 2.6 cycles of CORT with evidence of weight loss in CV and CR groups relative to the VV group on the final day of measurement, day 98 of the experiment. (C) Body mass for females exposed to 2.6 cycles of CORT, with no evidence of weight loss due to CORT treatment at any point in the experiment.

