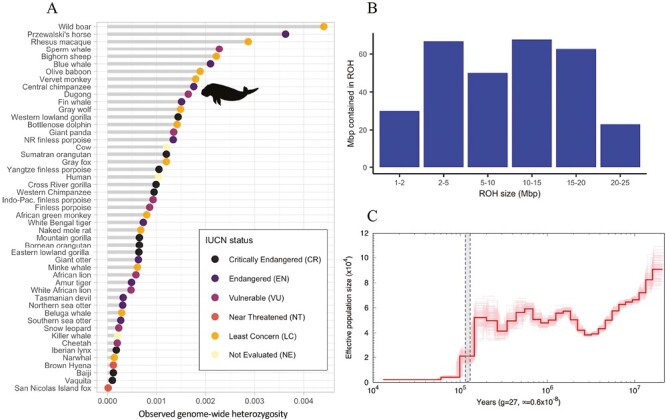
Fig. 2.

Diversity and demographic history of the dugong. A) Comparison of genome-wide heterozygosity in dugongs and other mammals drawn from the literature, based on Robinson et al. (2016). Dots are colored by the endangered status according to the International Union for Conservation of Nature (IUCN) Red List for Threatened Species. B) Count of runs of homozygosity (ROH) ≥1 Mbp across the dugong autosomal chromosomes of this study, binned by size. C) Effective population size over time, inferred with PSMC and scaled to the dugong generation time and mutation rate. Lighter lines represent bootstrap replicates. Vertical dashed bar represents the last interglacial period from approximately 130 to 115 ka.
