


Figure 6.
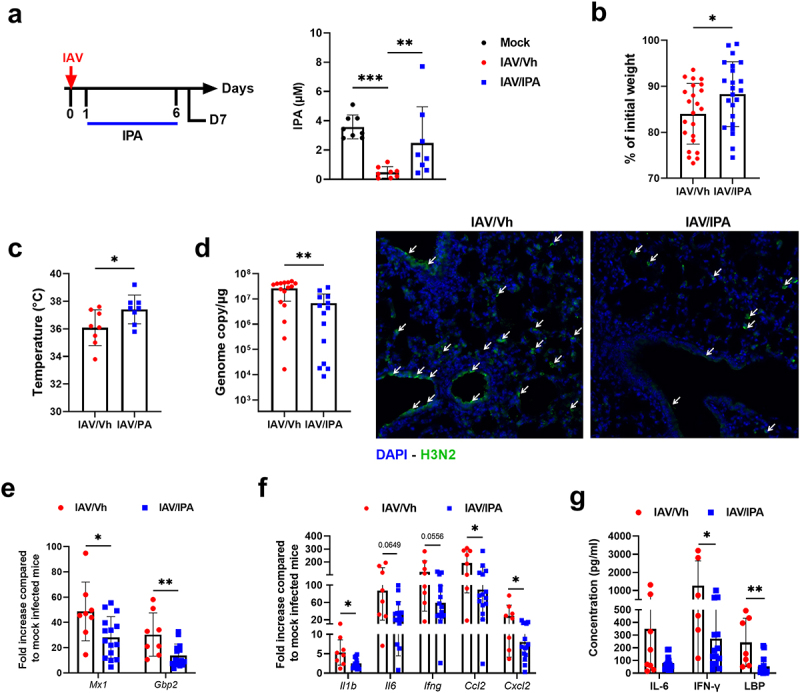
Effect of IPA treatment on viral load and inflammation during influenza infection. (a), left panel, schematic procedure. Mice were daily treated by oral gavage with vehicle (0.5% methyl cellulose in sterile water) or IPA (40 mg/kg/day) on D1 until D6. Mice were sacrificed on D7. right panel, systemic concentration of IPA in vehicle-treated and IPA-treated IAV-infected mice. Non-infected (mock) mice were used as controls. Errors indicate mean ± SD (n = 8). (b), percentage loss relative to initial body weight. Errors indicate mean ± SD (n = 22–24, pool of three independent experiments). (c), body temperature (n = 8). (d), left panel, quantification of viral load in the whole lung using specific TaqMan RT-qPCR. Data are expressed as genome copy number (M1 protein)/μg RNA. right panel, viral protein labelling (immunofluorescence) was performed on lung sections collected at 7D. Bars: 25 μm. (e and f), mRNA copy numbers were quantified by RT-qPCR. The data are expressed as the mean of change relative to average gene expression in non-infected animals. (g), serum proinflammatory cytokines and markers of altered intestinal barrier were quantified by ELISA. (d-g). Errors indicate mean ± SD (n = 7–16, two pooled experiments). Significant differences were determined using using the Kruskal-Wallis test (a) or the Mann Whitney U test (b-g) (*p < 0.05; ** p < .01, *** p < .001).