


Figure 7.
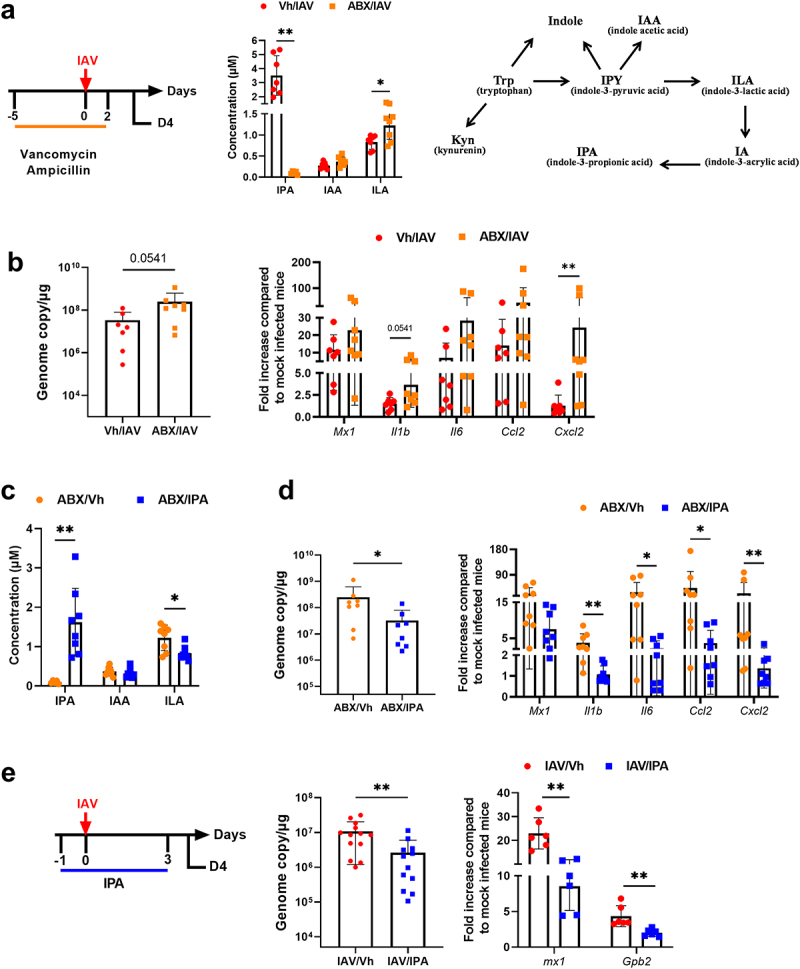
Role of IPA-producing bacteria in the control of viral load and inflammation. (a), left panel, schematic procedure. Mice were treated with vancomycin and ampicillin 5 days prior to the onset of infection until D2. Mice were sacrificed on D4. middle panel, systemic concentration of IPA, ILA and IAA in antibiotic-treated mice. right panel, schematic showing the conversion pathway of tryptophan into different bioactive indole metabolites including those that require the gut microbiota for conversion. (b), quantification of viral load in the whole lung using specific TaqMan RT-qPCR. Data are expressed as genome copy number (M1 protein)/μg RNA. (c and d), the same parameters (a and b) were measured by this time after supplementation, or not, with IPA (oral gavage, 40 mg/kg/day, from one day before infection to D3). (e), left panel, experimental procedure. Mice were daily treated or IPA one day before infection until D3. Mice were sacrificed on D4. middle and right panels, viral load and gene expression were quantified by RT-PCR. For all graphs, errors indicate mean ± SD. a-d and e, right panel, one experiment out of two is depicted (n = 6–8). e, left panel, a pool of two experiments is depicted (n = 13–14). Significant differences were determined using the Mann Whitney U test (*p < .05; ** p < .01).