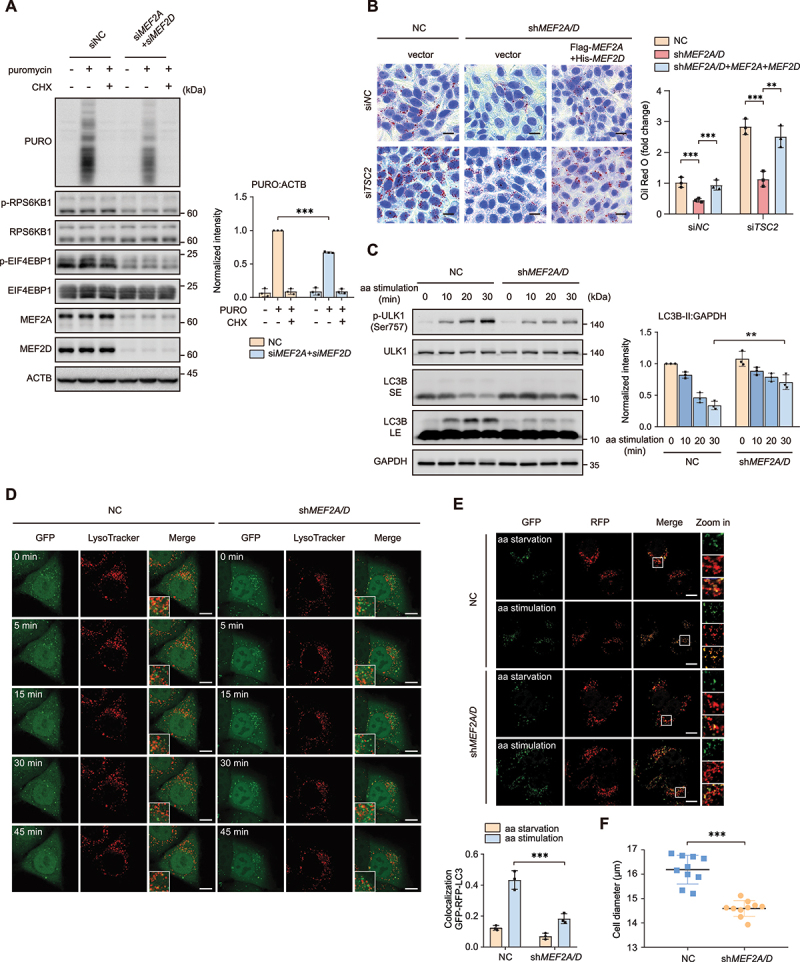
Figure 2.

MEF2A and MEF2D are required for MTORC1 mediated protein, lipid synthesis and inhibit autophagy. (A) HeLa cells depletion of both MEF2A and MEF2D by indicated siRNA were treated with amino acid administration in the presence or absence of 10 μg/ml puromycin (PURO) and cycloheximide (CHX). Cell lysates were analyzed by western blot with an antibody to puromycin (17H1). Right plots show the ratio of PURO:ACTB. (B) MEF2A and MEF2D double-knockdown HeLa cells with or without transiently re-expressing MEF2A and MEF2D after utilized TSC2-targeting (siTSC2) or control (siNC) siRNA for 48 h under normal culture condition. Oil red O staining was performed to quantify intracellular lipid levels. Scale bar: 20 μm. (C) control or shRNA-mediated depletion of MEF2A and MEF2D HeLa cells were treated with the starvation of amino acids for 1 h and then restimulated with amino acids for indicated time. Phospho-ULK1 (Ser757), ULK1, LC3B-II levels were analyzed by western blotting. Right plot shows the quantification of LC3B-II:GAPDH. Short exposure (SE), long exposure (LE). (D) MEF2A and MEF2D knockdown and control HeLa cells that stably express GFP-LC3 were starved of amino acids for 1 h and then restimulated with amino acids for indicate duration and stained with LysoTracker. Time-lapse images were taken. Scale bar: 5 μm. (E) MEF2A and MEF2D double-knockdown and control HeLa cells were transfected for 24 h with GFP-RFP-LC3 adenovirus. After that, cells were subjected to amino acid starvation for 4 h and restimulation for 30 min. Autophagy flux was tested by confocal. Plot on bottom shows the ratios of colocalization of GFP and RFP. Scale bar: 10 μm. (F) statistical analysis of the cell diameters of control HeLa cells and the cells that depletion of MEF2A and MEF2D by using a cell counter. Data are presented as the mean ± S.E.M. (n = 3 independent experiments for A, B and C, n = 3 independent fields per condition for E, n = 10 per group for F. two-sided Student’s t-test for A, C, D and E, one-way ANOVA for B and E, *P < 0.05; **P < 0.01; ***P < 0.001; ns, not significant compared with indicated group).
