
Figure 4.
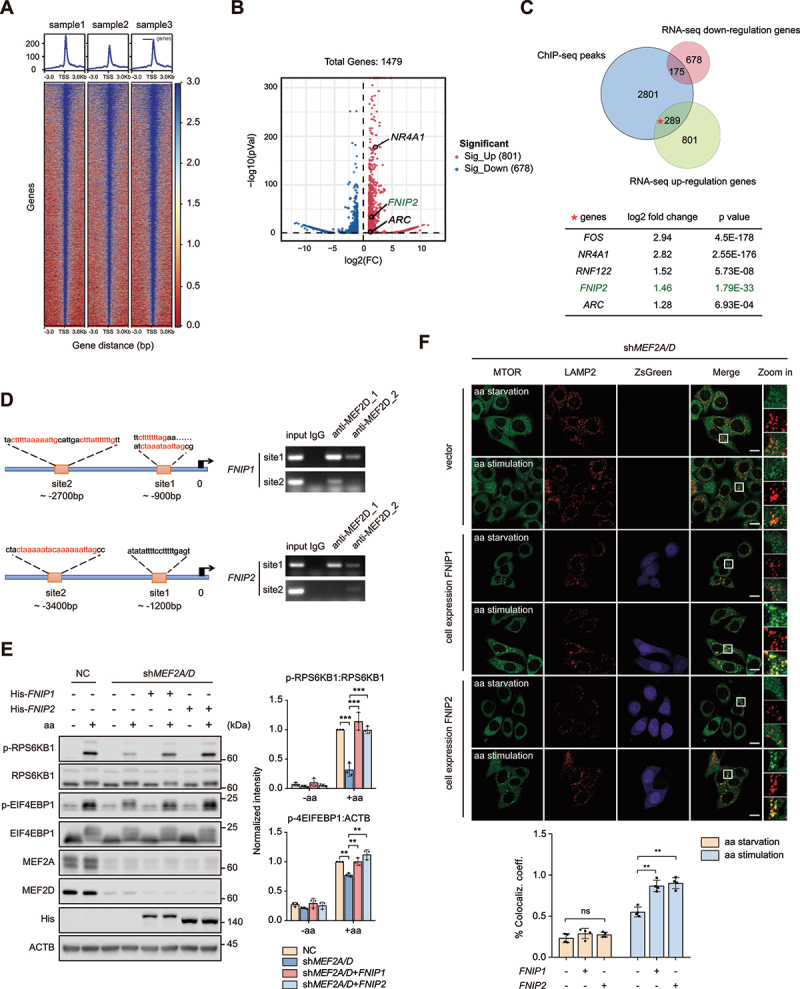
MEF2A and MEF2D control MTORC1 lysosome localization and activation via transcriptional regulation of FNIP1 and FNIP2. (A) heatmap of the binding sites of MEF2s at the positions − 3.0 kb upstream to + 3.0 kb downstream relative to the transcription start site (TSS). (B) volcano plot showing DEGs in control and MEF2-VP16 overexpression HeLa cells. The significant changed upregulated genes were labeled with gene names, NR4A1 and ARC are well-characterized substrates of MEF2s. (C) venn diagrams displaying the overlap of downregulated and upregulated genes from the transcriptome with MEF2 bound genes. Bottom table shows FNIP2 and other genes which are well known as MEF2s substrates including Fos/c-fos, NR4A1, ZNF122 and ARC in the subset of overlap of upregulated genes with MEF2 bound genes. (D) left-schematic shows the predicted MEF2 binding sites by conserved MEF2 consensus at the positions upstream to FNIP1 and FNIP2 genes transcription start site (TSS). Right plots show the PCR results revealed by chromatin immunoprecipitation assay. MEF2D_1,2 indicate the ChIP-PCR results by different antibodies (1-BD biosciences, 610774; 2-CST, 77986). (E) control (lanes 1–2) and MEF2A and MEF2D double-knockdown (lanes 3–8) HeLa cells that either transfected with indicated plasmids were starved of and restimulated with amino acids. Phosphorylation and protein levels of RPS6KB1 and EIF4EBP1 were determined by immunoblotting, as indicated. Plots on the right show p-RPS6KB1:RPS6KB1 (top) and p-EIF4EBP1:ATCB (bottom) ratios. (F) MEF2A and MEF2D double-knockdown HeLa cells stably overexpressing FNIP1 or FNIP2 by pLVX-IRES-ZsGreen constructs were starved of and restimulated with amino acids before coimmunostained of LAMP2 and MTOR and analyzed by confocal. MTOR (green), LAMP2 (red), ZsGreen-FNIP1 (violet) and ZsGreen-FNIP2 (violet). The plot on the bottom shows the colocalization coefficient. Scale bar: 10 μm. Data are presented as the mean ± S.E.M. (n = 3 independent experiments for E. n = 4 independent fields per condition for F. one-way ANOVA for F, two-way ANOVA for E **P < 0.01, ***P < 0.001).