
Figure 7.
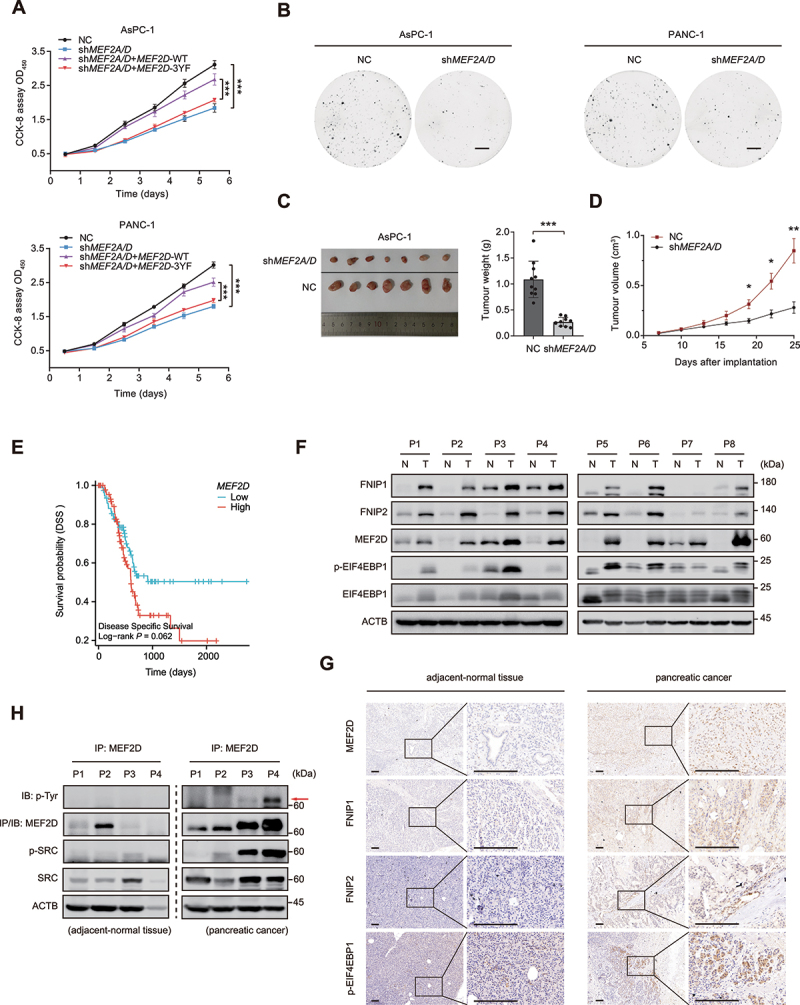
MEF2D promotes pancreatic cancer cell proliferation and correlates with clinical and pathological parameters. (A) pancreatic cancer cell line AsPC-1 (top) and PANC-1 (bottom) that depletion of MEF2A and MEF2D, transfected with either Flag-tagged MEF2D-WT or MEF2D-3YF, respectively and subjected to the cell proliferation assay (CCK8) to determine viable cell number. NC and knockdown of both MEF2A and MEF2D group co-transfected with empty vector. (B) the colony formation assay was performed with MEF2A and MEF2D double-knockdown AsPC-1 cells (left) or PANC-1 cells (right). The cells were maintained in complete medium containing 10% FBS for two weeks before staining and imaging. Scale bars: 5 mm. (C) Representative images (left) and weights (right) of xenograft tumors from nude mice implanted with MEF2A and MEF2D double-knockdown AsPC-1 cells versus control cells. n = 10 mice per group. (D) volumes of tumor burden in nude mice implanted with MEF2A and MEF2D double-knockdown or control AsPC-1 cells were measured after implantation. n = 10 mice per group. (E) TCGA cohort of pancreatic cancer patients were divided into two groups according to the median level of MEF2D mRNA expression. Overall survival was compared between these two groups, as shown in Kaplan-Meier curves. Log-rank P values are indicated. (F) immunoblot analysis of MEF2D, FNIP1, FNIP2, EIF4EBP1 and p-EIF4EBP1 were performed in pancreatic tumors and paired adjacent normal tissues. ACTB was probed for as a loading control. Tumor-adjacent normal tissue (N), tumor (T). (G) randomly selected pancreatic cancer samples and their paired adjacent normal tissues were lysed and subjected to IP against MEF2D, followed by immunoblotting with the pan p-Tyr antibody. (H) Representative immunohistochemistry of pancreatic cancer and paired adjacent normal tissue sections were stained for MEF2D, FNIP1, FNIP2 and p-EIF4EBP1 respectively. Scale bars: 200 μm. Data are presented as the mean ± S.E.M. (n = 3 independent experiments for a and B, n = 8 biologically independent samples for F, n = 4 biologically independent samples per group for G and H. two-sided Student’s t-test for a and D, *P < 0.05, **P < 0.01, ***P < 0.001).