
Figure 1.
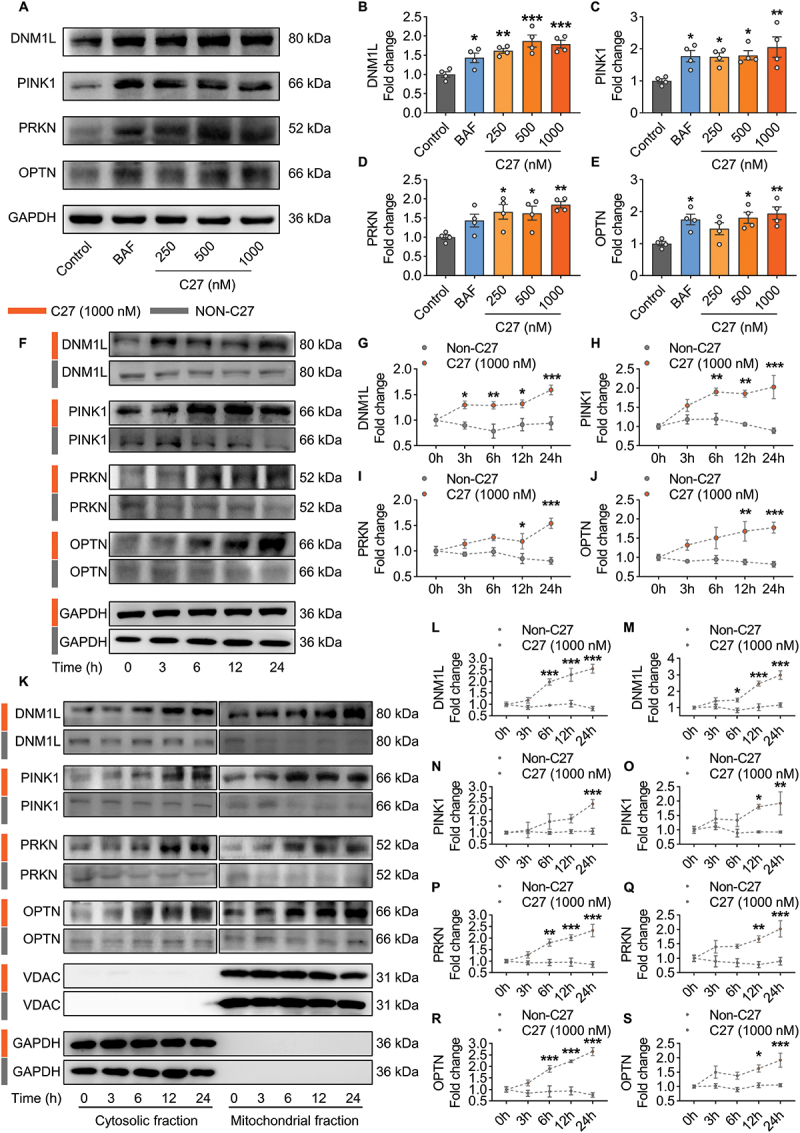
C27-induced mitophagy in microglial cells. (A–E) concentration-dependent upregulation of mitophagy markers in BV2 microglial cells exposed to C27. Representative immunoblot images (A) and the quantified results of DNM1L (B), PINK1 (C), PRKN (D), and OPTN (E) (n = 4). (F–J) time-dependent upregulation of mitophagy markers in BV2 microglial cells exposed to C27 (1000 nM). Representative immunoblot images (F) and the quantified results of DNM1L (G), PINK1 (H), PRKN (I), and OPTN (J) (n = 4). (K–S) C27 upregulated the levels of mitophagy markers in a time-dependent manner in the cytosolic fractions and mitochondrial fractions in BV2 microglial cells. Representative immunoblot images (K) and the quantified results of DNM1L (L, M), PINK1 (N, O), PRKN (P, Q) and OPTN (R, S) (n = 4). GAPDH (for total and cytosol) or VDAC (for mitochondria) was used as the protein loading control. Data are presented as the mean ± SEM. One-way ANOVA followed by Dunnett’s post hoc test (B–E) or two-way ANOVA followed by Sidak’s post hoc test (G–J, L–S) were used to determine statistical significance. *P < 0.05, **P < 0.01, ***P < 0.001 vs. control.