
Figure 6.
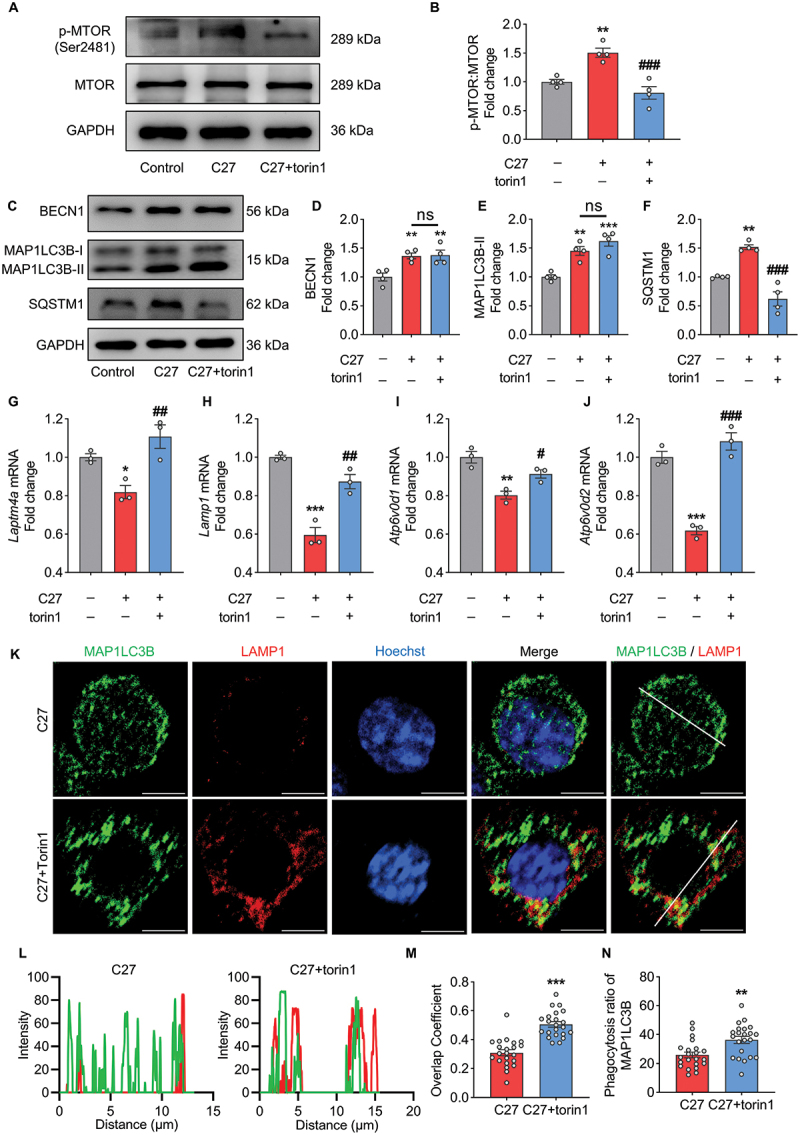
Torin1 treatment recovered the lysosomal function impaired by C27 in BV2 microglia cells. (A–B) the activation of MTOR was measured by western blotting (n = 4). (C–F) Representative immunoblots (C) and bar graphs (D–F) showing western blot analyses of BECN1 (D), MAP1LC3B-II (E) and SQSTM1 (F) in BV2 microglial cells pretreated with 2 μM of torin1 for 2 h, followed by exposure to C27 (1000 nM) for 24 h (n = 4). (G–J) the mRNA expressions of lysosome-related genes, such as Laptm4a (G), Lamp1 (H), Atp6v0d1 (I), and Atp6v0d2 (J), were measured by qPCR analysis in BV2 microglial cells pretreated with 2 μM of torin1 for 2 h, followed by exposure to C27 (1000 nM) for 24 h (n = 3). (K) Representative images of MAP1LC3B co-labeling with LAMP1 in BV2 microglial cells pretreated with 2 μM of torin1 for 2 h followed by exposure to C27 (1000 nM) for 24 h. (L) the corresponding MAP1LC3B and LAMP1 intensity along the white line, colors as in merged images. Scale bar: 5 μm. (M, N) quantitative analysis of overlap coefficient of MAP1LC3B and LAMP1 (M) and lysosomal phagocytosis ratio of MAP1LC3B (N) (n = 20–25 cells per group). Data are presented as the mean ± SEM. One-way ANOVA followed by Dunn’s post-hoc test was used to determine the statistical significance between multiple groups. Student’s t-test was used to measure significance between two groups. *P < 0.05, **P < 0.01, ***P < 0.001 vs. control. #P < 0.05, ##P < 0.01, ###P < 0.001 vs. C27.