
Figure 8.
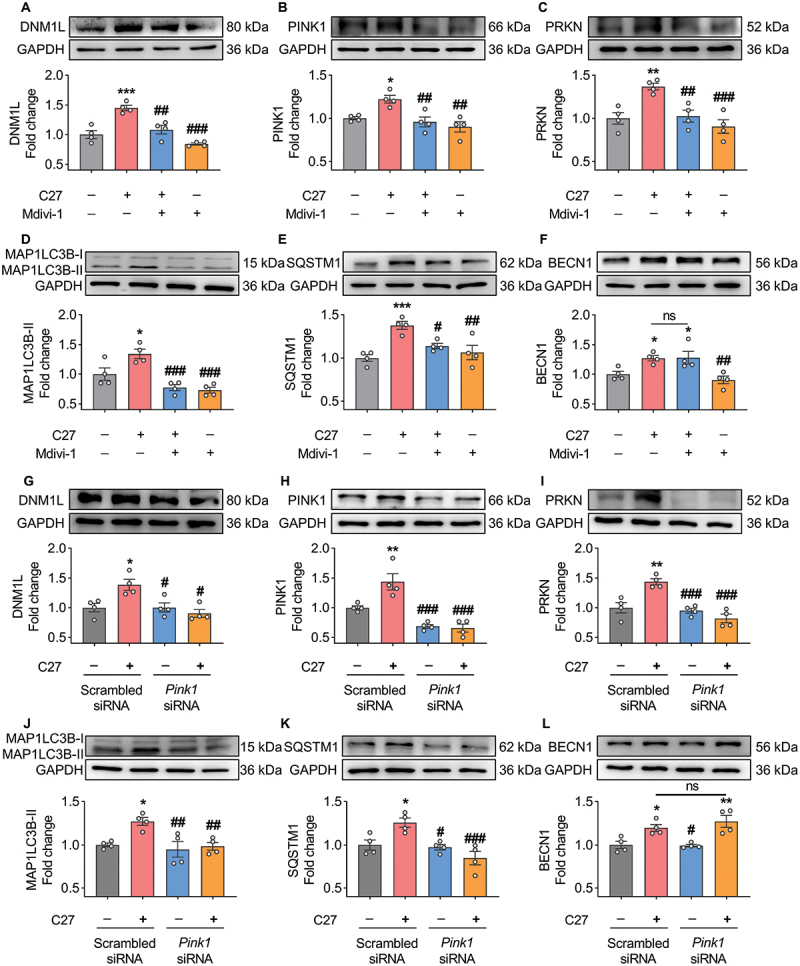
Pharmacological inhibition and gene silencing of mitophagy blocked C27-induced mitophagy. (A–C) Representative western blots showed the expression of mitophagy markers, such as DNM1L (A), PINK1 (B), and PRKN (C) in BV2 microglial cells pretreated with 5 μM of Mdivi-1 (a mitophagy inhibitor) for 1 h, followed by exposure to C27 (1000 nM) for 24 h (n = 4). (D–F) Representative western blots showing expression of autophagy markers, such as MAP1LC3B-II (D), SQSTM1 (E), and BECN1 (F) in BV2 microglial cells pretreated with 5 μM of Mdivi-1 for 1 h, followed by exposure to C27 (1000 nM) for 24 h (n = 4). (G–L) Representative western blots showed the expression of DNM1L (G), PINK1 (H), PRKN (I), MAP1LC3B-II (J), SQSTM1 (K), and BECN1 (L) in BV2 microglial cells transfected with either PINK1 siRNA or scrambled siRNA, following exposure to C27 (1000 nM) for 24 h (n = 4). Data are presented as the mean ± SEM. Non-parametric mann – Whitney U test was used to measure significance between two groups (G). One-way ANOVA followed by Dunn’s post-hoc test was used to determine the statistical significance between multiple groups. *P < 0.05, **P < 0.01, ***P < 0.001 vs. control; #P < 0.05, ##P < 0.01, ###P < 0.001 vs. C27.