
Figure 3.
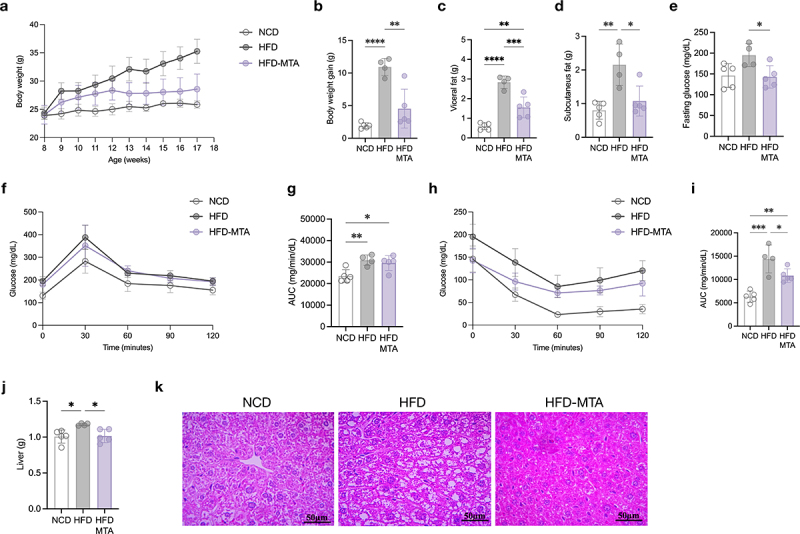
MTA ameliorated obesity and metabolic disorders.
(a) Body weight changes. (b) Body weight gain during the experimental period. (c) Weight of visceral fat. (d) Weight of subcutaneous fat. (e) Fasting glucose. (f) Plasma glucose profile measured during the OGTT. (g) AUC derived from oral glucose tolerance test (OGTT). (h) Plasma glucose profile measured during the ITT. (i) AUC derived from insulin tolerance test ITT. (j) Weight of liver. (k) Representative histological features of H&E-stained liver tissue. Data are means and SD. Statistical analyses were performed by one-way ANOVA with Tukey’s range test (*, P < .05; **, P < .01; ***, P < .001; ****, P < .0001). N = 5, 4, 5 mice per group. Abbreviations: AUC, area under the curve; HFD, high-fat diet; MTA, 5’-methylthioadenosine; NCD, normal chow diet; OGTT, oral glucose tolerance test.