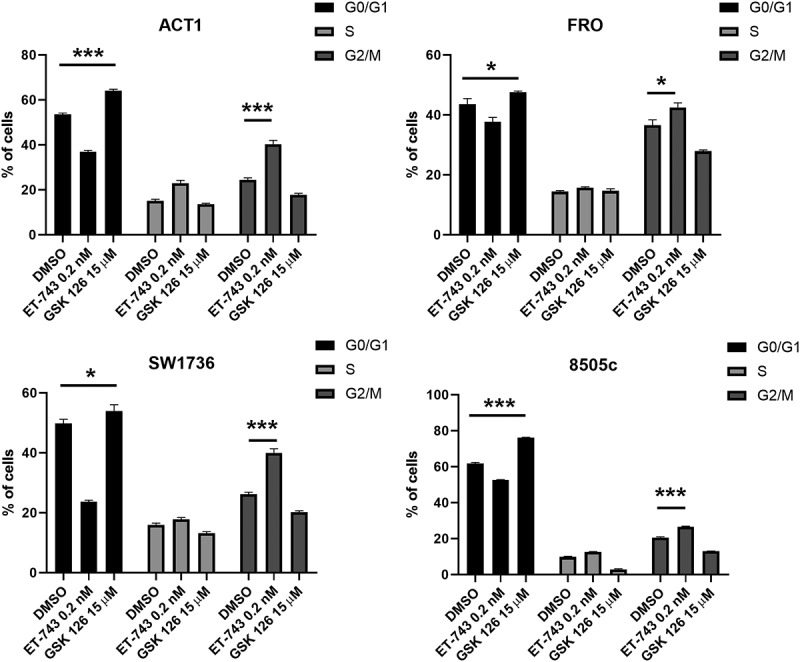
Figure 5.

Effects of ET-743 and GSK126 on cell cycle progression on ATC cell lines. cell-cycle profile after 48 h of treatment with ET-743 and GSK126 analyzed by PI incorporation and flow cytometry in the ACT1, FRO, 8505c and SW1736 cell lines. Data are shown as mean ± SD (n = 3) *p < 0.0.5; **p < 0.01; ***p < 0.001.
