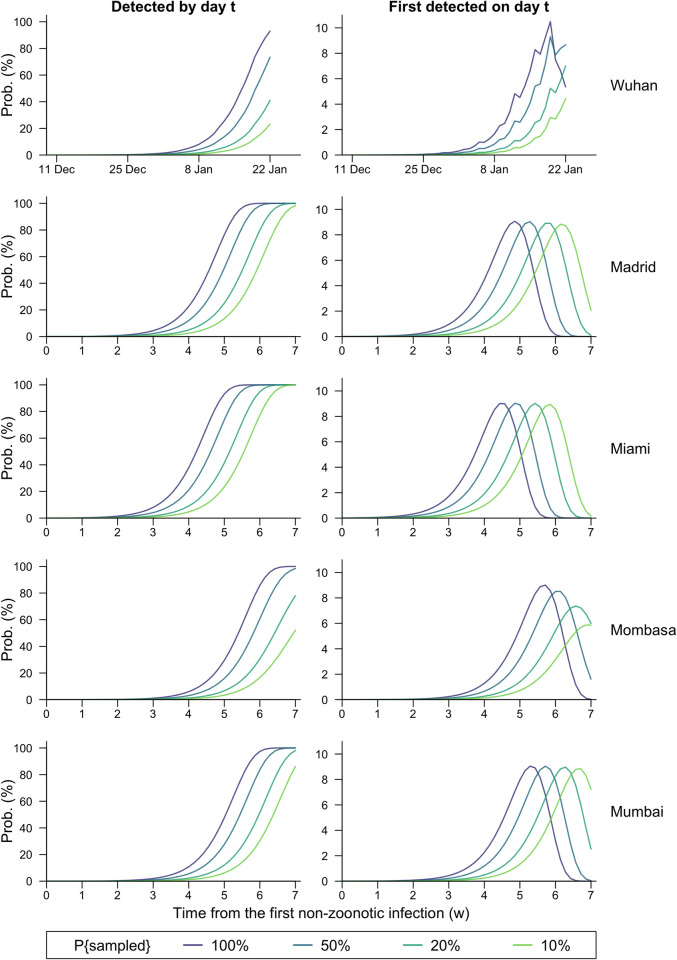
Fig 5. Detection probability against time for different epicentres.
The probability of the virus having been detected by day t (column 1) or first detected on day t (column 2) under four scenarios with diverse sampling probabilities (100%, 50%, 20%, 10%) for inbound flights, assuming different epicentres—Wuhan, Madrid, Miami, Mombasa, and Mumbai—and routine aircraft wastewater surveillance at all the 20 airports investigated.

