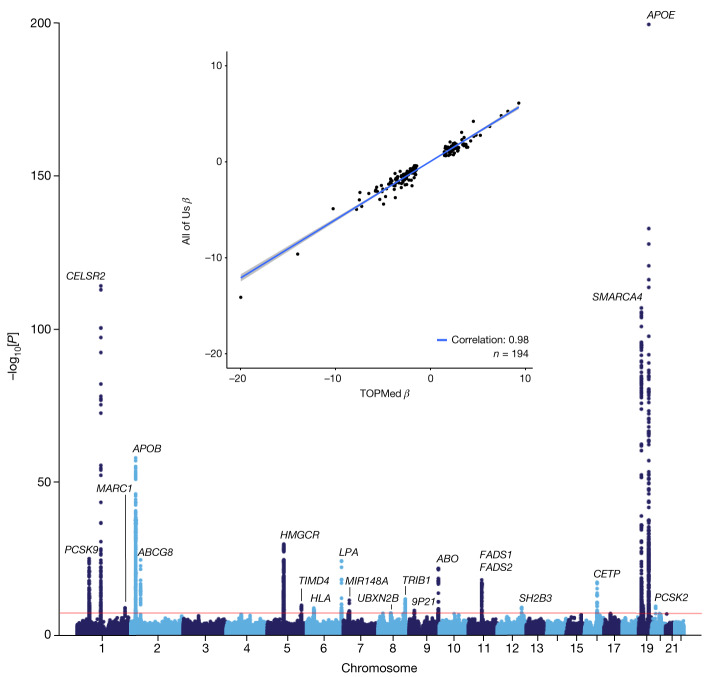
Fig. 3. All of Us LDL-C GWAS.
Manhattan plot demonstrating robust replication of 20 well-established LDL-C genetic loci among 91,749 individuals with 1 or more LDL-C measurements. The red horizontal line denotes the genome wide significance threshold of P = 5 × 10⁻⁸. Inset, effect estimate (β) comparison between NHLBI TOPMed LDL-C GWAS (x axis) and All of Us LDL-C GWAS (y axis) for the subset of 194 independent variants clumped (window 250 kb, r2 0.5) that reached genome-wide significance in NHLBI TOPMed.

