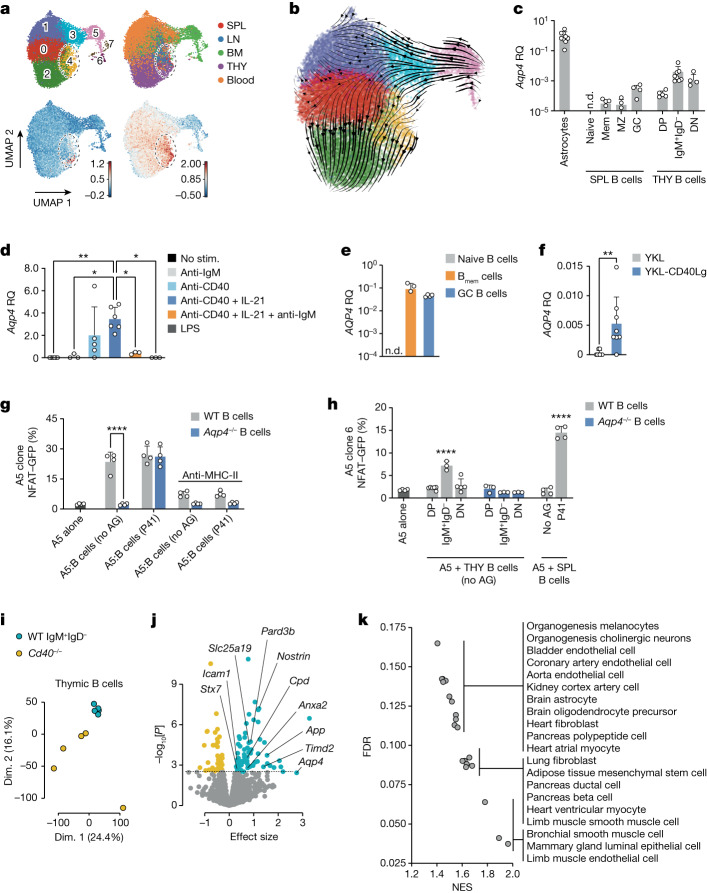
Fig. 3. Thymic B cells upregulate AQP4 in a CD40-dependent manner and present it to T cells in the context of MHC-II.
a,b, Uniform manifold approximation and projection (UMAP) representation of scRNA-seq data of B cells sorted from the spleen (SPL), lymph node (LN), bone marrow (BM), thymus (THY) and blood of young adult naive WT mice. a, Annotated Leiden clusters with a resolution of r = 0.7 (top left). Top right, cells colour-coded by organ (a detailed breakdown is provided in Extended Data Fig. 4a). Bottom left, the gene score based on a published gene signature associated with early CD40 responses in B cells40. Bottom right, the gene score based on a published gene signature of GC light-zone B cells41,42. The colour scale indicates relative gene score expression. Leiden cluster 4 is highlighted in all of the panels. b, RNA trajectory inference derived from spliced and unspliced mRNA ratios, as determined by UniTVelo. c, Quantification of the relative gene expression of Aqp4 normalized to primary naive astrocytes. B cell subsets were sorted from unmanipulated WT mice. DN, double negative (IgM–IgD–); DP, double positive (IgM+IgD+); mem, memory; MZ, marginal zone; n.d., not detected. d, FACS-sorted CD19+ B cells from WT spleens were cultured and stimulated (stim.) for 2 days as indicated. Relative gene expression was normalized to control stimulation with goat anti-human IgG (H+L). e, Human naive (CD19+CD27−CD38−, naive B cells), memory (CD19+CD27+CD38−, Bmem cells) and GC (CD19+CD27+CD38+) B cells were FACS-sorted from human tonsil tissue (n = 4 biological replicates) and AQP4 expression was analysed using qPCR. The symbols represent biological replicates. f, Naive human B cells were sorted from peripheral blood mononuclear cells and stimulated with control fibroblastic feeder cells (YKL) or YKL cells equipped with membrane-bound CD40L (CD40Lg) (n = 8 biological replicates) before assessment of AQP4 expression using qPCR. g,h, Quantification of NFAT–GFP expression in a coculture system with a T cell hybridoma cell line (A5 cells) engineered to express an AQP4-specific TCR and either B cells prestimulated with anti-CD40 plus IL-21 for 2 days (g) or thymic B cell subsets derived from WT and Aqp4−/− mice at a ratio of 1:2.5 (h). AG, antigen. For c–h, data are mean ± s.d. Statistical analysis was performed using one-way ANOVA with Tukey’s post test (d), two-tailed unpaired t-tests (f) and two-way ANOVA with Sidak’s post test (g and h). The symbols indicate biological replicates. i–k, Total RNA was isolated from thymic B cells that were FACS-sorted from WT and Cd40−/− mice (n = 5 biological replicates) and processed for bulk RNA-seq analysis. i, PCA analysis. Dim., dimension. j, Volcano plot of genes encoding membrane proteins. Differentially upregulated and downregulated genes in WT versus Cd40−/− B cells are highlighted in blue and orange, respectively. Gene labels correspond to the differentially upregulated genes in thymic WT IgM+IgD− B cells, which encode structural proteins with known membrane localization43. k, Gene set enrichment analysis for cell type signature genes (MSigDB M8) in WT IgM+IgD− thymic B cells versus Cd40−/− thymic B cells. A selection of significantly (P < 0.05, false-discovery rate (FDR) < 0.25) enriched gene sets (normalized enrichment score (NES)) is shown.

