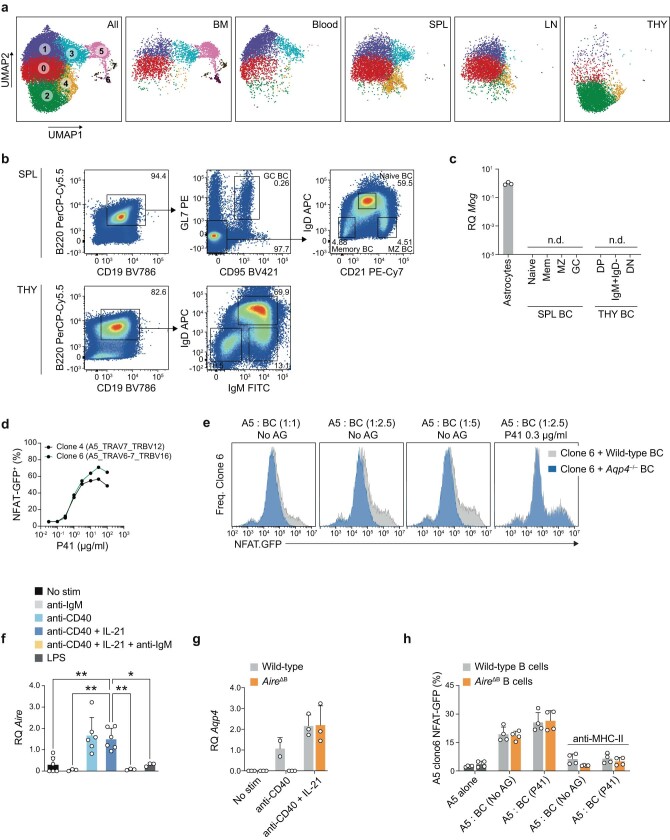
Extended Data Fig. 4. Thymic B cells are distinct from naïve peripheral B cells and express and present AQP4.
(a) UMAP representation of single-cell RNA sequencing data of B cells sorted from bone marrow (BM), blood, spleen (SPL), lymph nodes (LN), and thymus (THY) of naïve wild-type mice. Left panel: Clusters as determined by Leiden with resolution r = 0.7, shown for cells of all organs. Other panels: Only cells from the respective organs are depicted as indicated. (b) Splenic and thymic B cell subsets were sorted from naïve wild-type mice according to the indicated gating strategy, and total RNA was isolated for quantitative PCR. (c) Relative gene expression (RQ) of myelin oligodendrocyte glycoprotein (MOG) in thymic and splenic B cell subsets (n = 2 biological replicates), normalized to astrocytes (n = 3). Data are shown as mean RQ ± SD. Symbols indicate biological replicates; zero-values are not depicted due to logarithmic scaling. n.d., not detected. (d) NFAT-GFP response as a measure of TCR triggering to titrated P41-concentrations in a coculture system of antigen-presenting cells (APC) and the T cell hybridoma cell line A5 transfected with either AQP4 TCR clone 4 or clone 6 (both n = 2). (e) Representative histogram overlays of NFAT-GFP responses in a coculture system of AQP4-specific TCR clone 6-transfected A5 cells and either wild-type or AQP4-deficient B cells in the absence or presence of exogenous P41. (f) Aire in wild-type and (g) Aqp4 in AireΔB splenic CD19+ B cells stimulated for two days under conditions as indicated. RQ was normalized to control stimulation with goat anti-human IgG (H + L). (h) Quantification of NFAT-GFP expression in a coculture system with a T cell hybridoma cell line (A5 cells) engineered to express an AQP4-specific TCR and B cells prestimulated with anti-CD40 plus IL-21 for two days, derived from wild-type or AireΔB mice (n = 4 biological replicates). All data in (f-h) are shown as mean ± SD and tested with (f) one-way ANOVA and Tukey’s post-test or (g, h) two-way ANOVA and Sidak’s post-test. * P < 0.05, ** P < 0.01. Unless otherwise specified, symbols represent biological replicates.

