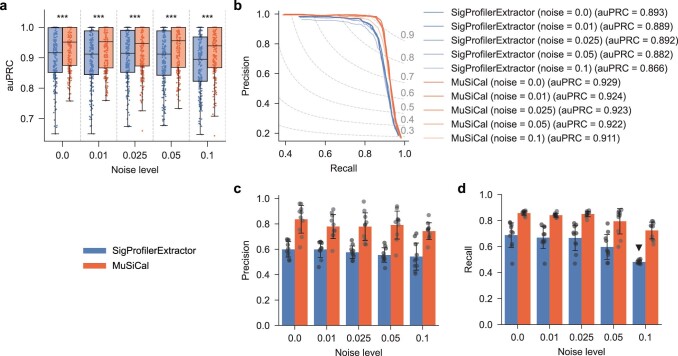
Extended Data Fig. 3. MuSiCal outperforms SigProfilerExtractor for de novo signature discovery at different noise levels.
See Methods for details on how different levels of random noise were added. a. Area under precision-recall curve (auPRC) for MuSiCal and SigProfilerExtractor at different noise levels. Each box in the box plot represents 250 synthetic datasets (25 tumor types × 10 replicates). auPRC was calculated for each dataset separately, as in Fig. 3b. ***: p < 0.0005. p-values were calculated with two-sided paired t-tests. Raw p-values from left to right: 7.5 × 10⁻¹⁰, 1.5 × 10⁻⁸, 1.7 × 10⁻⁶, 3.1 × 10⁻¹¹, 5.4 × 10⁻¹². b. Precision-recall curve (PRC) for MuSiCal and SigProfilerExtractor at different noise levels. Each PRC represents the average result of 250 synthetic datasets (25 tumor types × 10 replicates), as in Fig. 3c. c. Precision of MuSiCal and SigProfilerExtractor averaged across all tumor types at different noise levels. Recall was fixed at 0.9. Error bars indicate standard deviation over 10 replicates. d. Recall of MuSiCal and SigProfilerExtractor averaged across all tumor types at different noise levels. Precision was fixed at 0.98, corresponding to a false discovery rate (FDR) of 2%. The black triangle indicates the case where a precision of 0.98 was never achieved and the recall at the highest achieved precision was shown. Error bars indicate standard deviation over 10 replicates.

