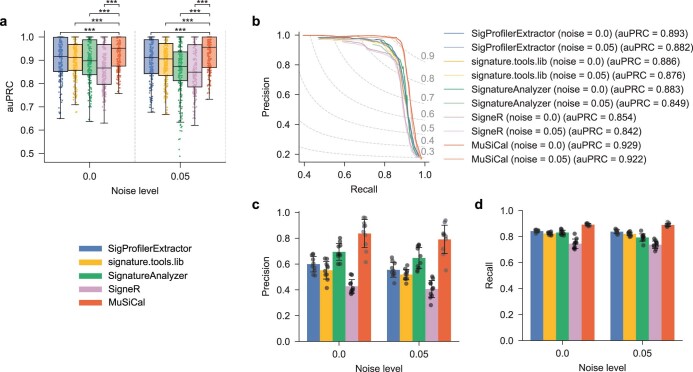
Extended Data Fig. 4. MuSiCal outperforms SigProfilerExtractor and three additional existing tools – signature.tools.lib, SignatureAnalyzer, and SigneR – for de novo signature discovery at different noise levels.
a. Area under precision-recall curve (auPRC) for all five tools at different noise levels. Random noise were added as in Extended Data Fig. 3. Each box in the box plot represents 250 synthetic datasets (25 tumor types × 10 replicates). auPRC was calculated for each dataset separately, as in Fig. 3b. ***: p < 0.0005. p-values were calculated with two-sided paired t-tests. Raw p-values from top to bottom at noise level 0.0: 1.2 × 10⁻²⁶, 1.4 × 10⁻¹⁵, 1.1 × 10⁻¹⁴, 7.5 × 10⁻¹⁰. Raw p-values from top to bottom at noise level 0.05: 1.7 × 10⁻²⁵, 1.3 × 10⁻²⁰, 5.8 × 10⁻¹⁶, 3.1 × 10⁻¹¹. b. Precision-recall curve (PRC) for all five tools at different noise levels. Each PRC represents the average result of 250 synthetic datasets (25 tumor types × 10 replicates), as in Fig. 3c. c. Precision of all five tools averaged across all tumor types at different noise levels. Recall was fixed at 0.9. Error bars indicate standard deviation over 10 replicates. d. Recall of all five tools averaged across all tumor types at different noise levels. Precision was fixed at 0.9, corresponding to a false discovery rate (FDR) of 10%. Here, precision was fixed at a smaller value compared to Fig. 3e, Supplementary Fig. 5d, and Extended Data Fig. 3d, because a precision of 0.98 was never achieved by SignatureAnalyzer or SigneR in many cases. Error bars indicate standard deviation over 10 replicates.

