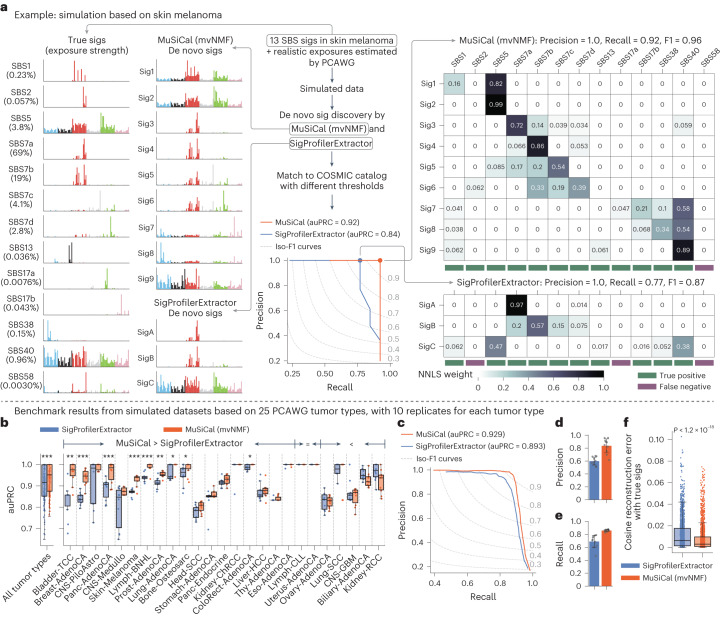
Fig. 3. MuSiCal outperforms the state-of-the-art algorithm SigProfilerExtractor for de novo signature discovery.
a, An example based on Skin-Melanoma demonstrating the metric for evaluating the quality of de novo signature discovery. A synthetic dataset is simulated from 13 SBS signatures specific to Skin-Melanoma (percentages below signature names denote exposure strengths) and the exposure matrix produced by the PCAWG Consortium. MuSiCal and SigProfilerExtractor are applied to derive de novo signatures, which are subsequently decomposed as nonnegative mixtures of COSMIC signatures with likelihood-based sparse NNLS at different likelihood thresholds (see ‘Refitting with likelihood-based sparse NNLS’ for more details). Precision and recall are then calculated at each threshold by comparing matched COSMIC signatures with the 13 true signatures, and auPRC is obtained. The matching result corresponding to the largest achieved F1 score is shown in the heatmap on the right. b, Comparison of MuSiCal and SigProfilerExtractor for de novo signature discovery from synthetic datasets based on 25 PCAWG tumor types with at least 20 samples. Ten independent simulations are performed for each tumor type. The box plot shows auPRC for each individual dataset. Tumor types are sorted according to the mean auPRC gain by MuSiCal. *P < 0.05, **P < 0.005, ***P < 0.0005. P values are calculated with two-sided paired t-tests. Raw P values from left to right (significant ones only): 7.5 × 10⁻¹⁰, 0.0034, 8.4 × 10⁻⁵, 1.0 × 10⁻⁴, 8.3 × 10⁻⁵, 5.6 × 10⁻⁵, 0.0012, 0.044, 0.032, 0.012. c, PRC of MuSiCal and SigProfilerExtractor averaged across all tumor types. d, Precision of MuSiCal and SigProfilerExtractor averaged across all tumor types. Recall is fixed at 0.9. Error bars indicate the standard deviation from ten independent simulations. e, Recall of MuSiCal and SigProfilerExtractor averaged across all tumor types. Precision is fixed at 0.98, corresponding to a false discovery rate of 2%. Error bars indicate the standard deviation from ten independent simulations. f, Cosine reconstruction errors for MuSiCal- and SigProfilerExtractor-derived de novo signatures (n = 1,798 and 1,564, respectively). Each de novo signature is decomposed into a nonnegative mixture of the true underlying signatures with NNLS. Cosine distance is then calculated between the reconstructed and the original de novo signature. The P value is calculated with a two-sided t-test.

