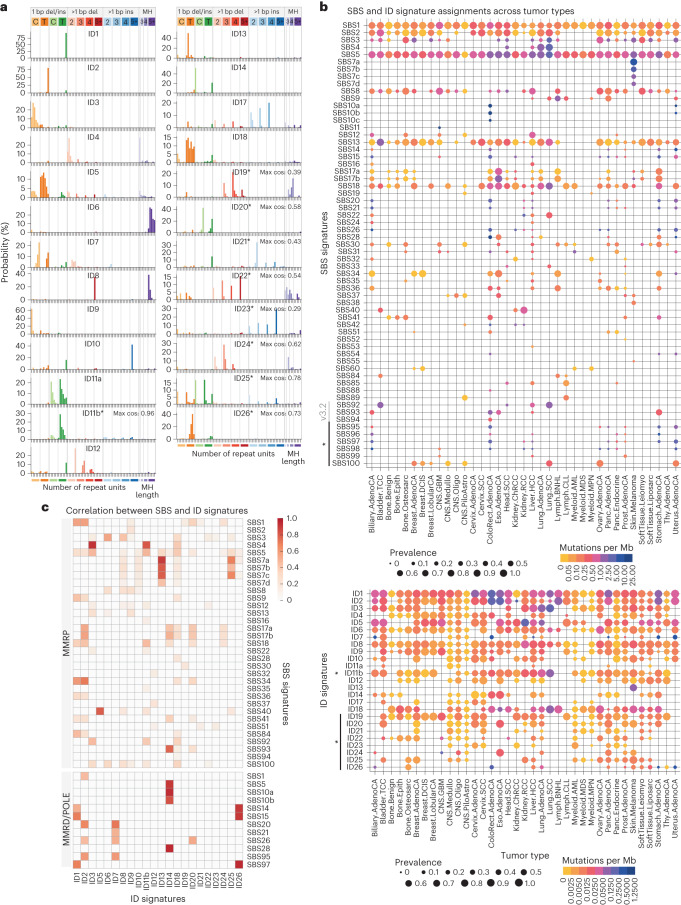
Fig. 6. Reanalysis of PCAWG data with MuSiCal uncovers new signatures and SBS–ID associations.
a, The catalog of ID signatures obtained from our reanalysis of PCAWG data with MuSiCal. An asterisk indicates newly added signatures not present in the current COSMIC catalog. Other signatures also have modified spectra. Each of the nine new signatures is decomposed using COSMIC signatures by NNLS. The resulting cosine similarities between the original and the reconstructed signatures are annotated next to each spectrum. b, MuSiCal-derived signature assignments in PCAWG samples for SBS (upper) and ID (lower) signatures. Marker size represents the prevalence of a signature; that is, the proportion of samples with nonzero exposures of the corresponding signature within a tumor type. Color indicates the median number of mutations per Mb contributed from the corresponding signature among samples with nonzero exposures. c, Heatmap of Pearson correlation coefficients between the per-sample exposures of SBS and ID signatures. The correlations are calculated for MMRP samples and samples with MMRD and/or POLE-exo mutations separately. Only the samples with at least 100 indels are used and only statistically significant associations are shown (adjusted P < 0.05). The correlations are also examined separately in each tumor type where the corresponding ID and SBS signatures are both active, and are excluded if they are significant in only a small fraction (<20%) of these tumor types.

