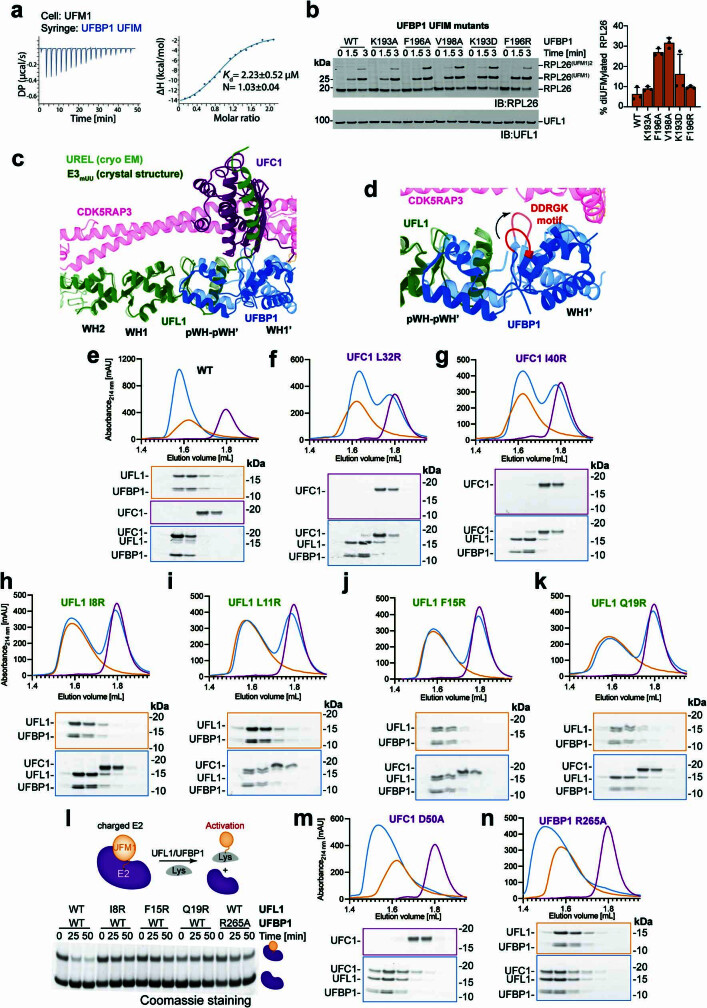
Extended Data Fig. 5. Analysis of UFBP1 UFIM:UFM1 and UREL:UFC1~UFM1 interactions.
a, ITC titration curve and the corresponding fitting curve for UFM1 and UFBP1 UFIM (178-204). Data are representative of n = 2 independent experiments. b, (Left) In vitro UFMylation assays with UFBP1 UFIM mutants and immunoblotted with the indicated antibodies. Data are representative of n = 3 independent experiments. (Right) Quantitative representation showing percentage of di-UFMylation (mean ± SD; n = 3) in the in vitro UFMylation assays. c, Overlay of the cryo-EM structure of the UREL complex and the crystal structure of E3mUU in complex with UFC1. d, Close-up view showing the conformational change of the DDRGK motif of UFBP1, highlighted in red, in the cryo-EM structure. e, Gel filtration chromatograms of E3mUU-ΔUFIM:UFC1 complex. Approximately 40 µM E3mUU were incubated with 15 µM UFC1 for 15 min at 4 °C and loaded on a Superdex 200 3.2/300 gl column. The corresponding peak fractions were collected and analysed on a 4-12% SDS-PAGE gel followed by Coomassie staining. f, to k, Gel filtration chromatograms of E3mUU-ΔUFIM:UFC1 complexes with mutations at the UFL1 α1/UFC1 α2 interface. l, Lysine discharge assays in the presence of E3mUU mutants. (Top) Schematic describing the assay workflow. (Bottom) Coomassie stained SDS-PAGE gel showing aminolysis of UFM1 from UFC1~UFM1 in the presence of E3mUU-ΔUFIM mutants. m, and n, SEC elution profiles of E3mUU-ΔUFIM:UFC1 complexes with mutations disrupting the UFBP1 R265:UFC1 D50 interaction.

