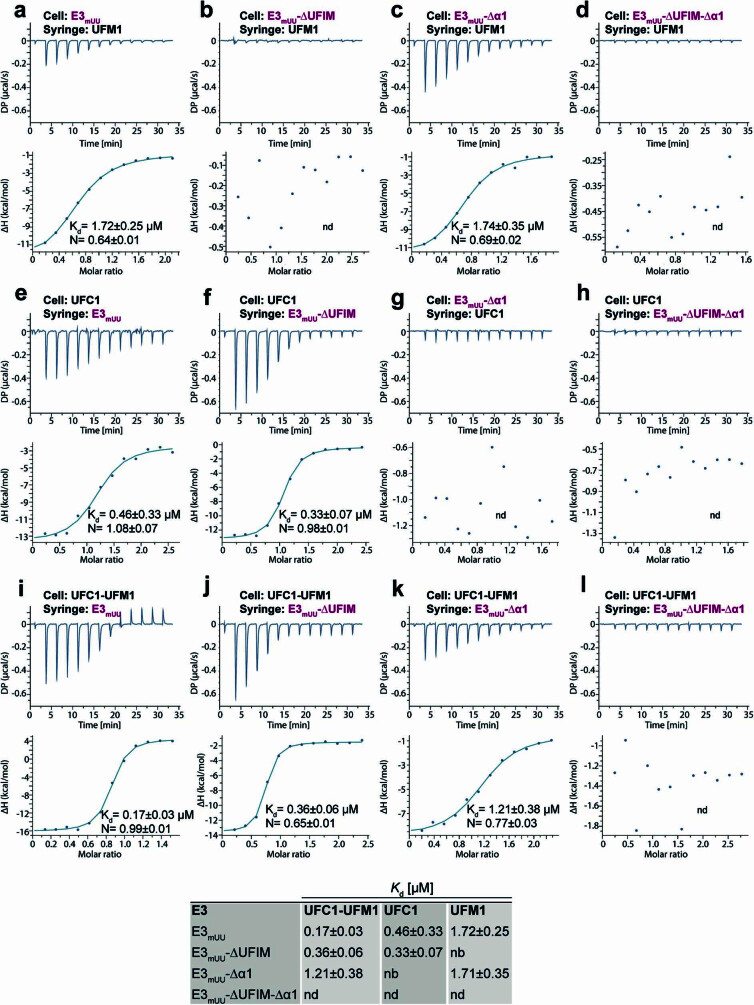
Extended Data Fig. 6. Binding curves for ITC experiments.
a – l, Representative ITC binding curves analysing interactions between indicated E3mUU proteins and UFC1, UFM1 or UFC1-UFM1. All experiments were performed in duplicates, the dissociation constants and stoichiometries were calculated based on both experiments. (Bottom) Summary of disassociation constants of the different E3mUU constructs with UFC1-UFM1, UFC1 and UFM1 measured by ITC. nd indicates that no binding was detected.

