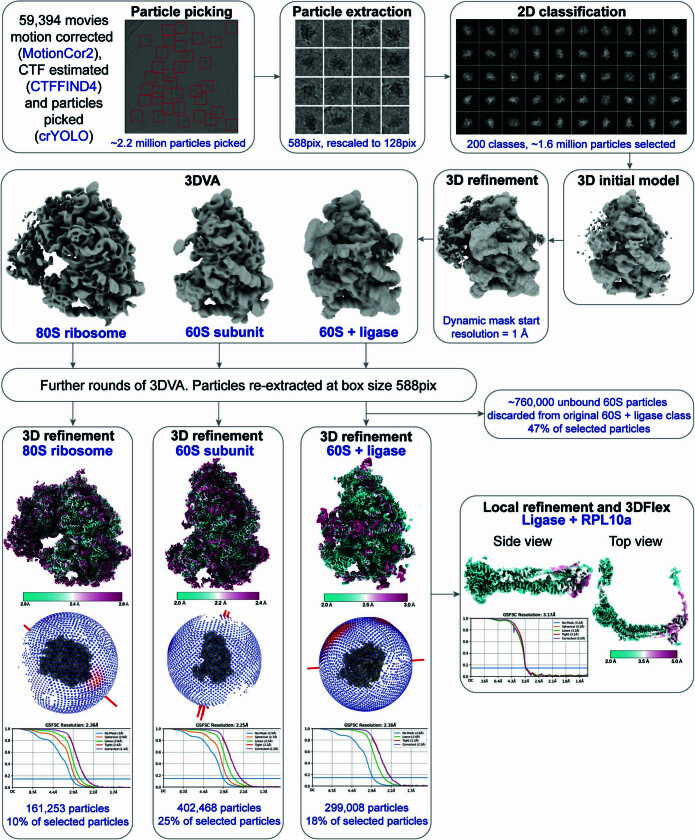
Extended Data Fig. 2. Cryo-EM data processing pipeline.
Cryo-EM data processing steps to obtain cryo-EM maps for the 80S ribosome, 60S ribosome subunit, UREL ligase-bound 60S ribosome and UREL bound to RPL10a. ~2.2 million picked particles were extracted using a box size of 588 pixels (pix), rescaled to 128 pix. After several rounds of 2D classification ~1.6 million ribosome-like particles were selected. All ribosome-like particles were pooled to generate an initial 3D model, followed by 3D refinement. 3D variability analysis (3DVA) separated three major classes: 80S ribosome, 60S subunit and UREL-bound 60S (60S+ligase). These underwent further rounds of 3DVA and cryoDRGN particle sorting to obtain homogenous particles, which were then re-extracted using the original box size, followed by a final 3D refinement. To generate the ligase+RPL10a map, signal corresponding to the 60S ribosome was subtracted and the region corresponding to the UREL ligase and RPL10a was locally refined. This was then further refined using 3DFlex training and reconstruction. Final maps are coloured by local resolution. 3D angular distribution representation and FSC curves are shown, calculated using the gold standard FSC cutoff of 0.143.

