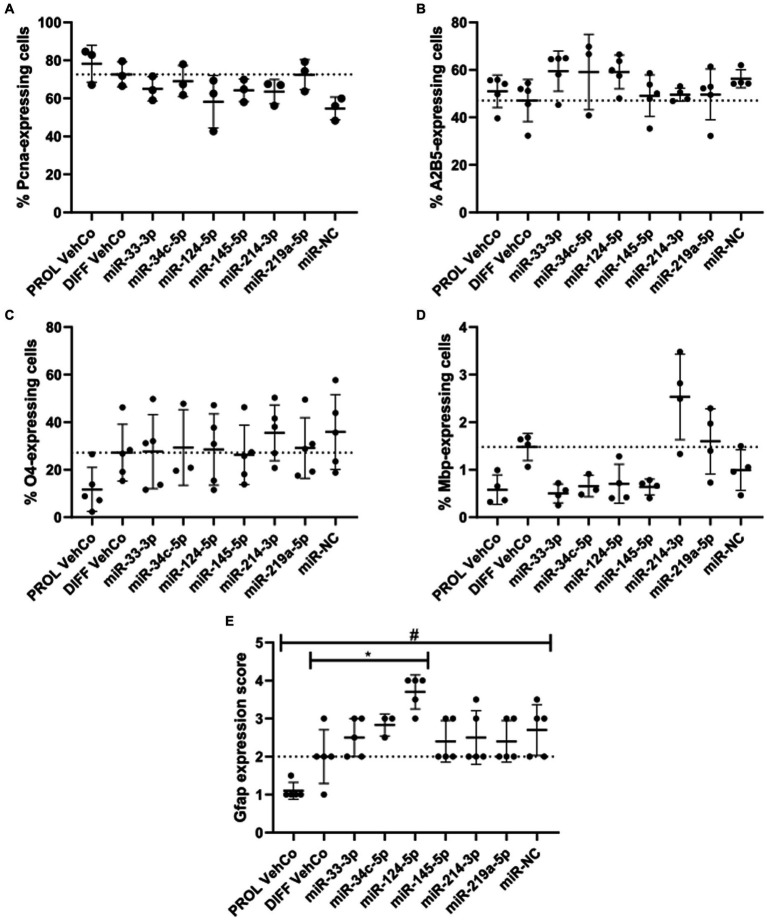
Figure 3.
The effect of five microRNA mimics on the differentiation of CG-4 cells in immunocytochemistry. The plots show the percentage of cells expressing (A) the proliferation marker Pcna, (B) the OPC marker A2B5, (C) the early differentiation marker O4, and (D) the late differentiation marker Mbp, as well as (E) the score of Gfap expression (mean with SD), calculated (A–D)/estimated (E) to the total number of cells (based on the detection of the nucleus counterstained with DAPI), resulting from the single transfection of each microRNA mimic (as labeled on the x-axis) in CG-4 cells in differentiation culture conditions, as well as the proliferation vehicle control (PROL VehCo). The score for Gfap expression ranges from 0 = none to 5 = abundant (namely 0 = no Gfap-positive (Gfap+) cells, 1 = a few Gfap+ cells on the whole coverslip, 2 = a few Gfap+ cells in a few grids of the coverslip, 3 = a few Gfap+ cells in several grids of the coverslip, 4 = many Gfap+ cells in several grids of the coverslip, 5 = many Gfap+ cells on the whole coverslip). The dotted line represents the mean value of the differentiation vehicle control (DIFF VehCo). The non-parametric one-way ANOVAs on all conditions were not significant, except for Gfap: adjusted p-value = 0.0148 (*) for miR-124-5p against DIFF VehCo, and adjusted p-value = 0.0261 (#) for PROL VehCo against microRNA mimic negative control (miR-NC) on Dunn’s multiple comparison test. Yet, Pcna-expression tended to decrease in miR-NC-transfected cells (non-significant non-parametric one-way ANOVA, but significant Dunn’s post-test against PROL VehCo). Data were from three to five experiments, in single replicates for each experimental and staining condition within each experiment. OPC, oligodendrocyte progenitor cells; SD, standard deviation. Representative fluorescence micrographs can be found in Supplementary Figures S3A–D.

