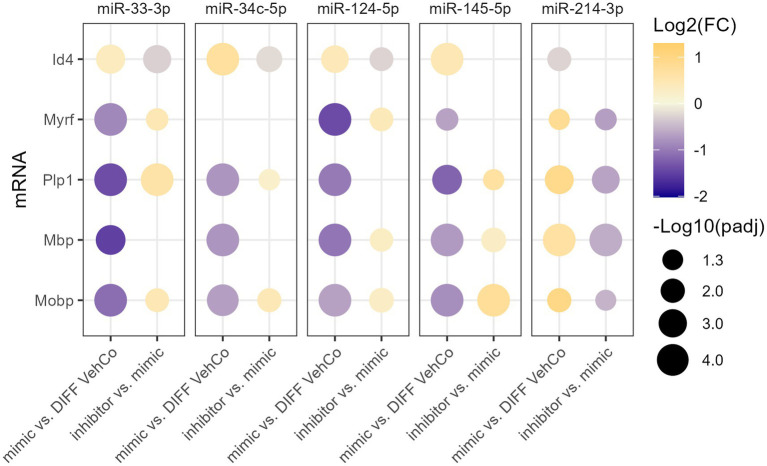
Figure 4.
The effect of five microRNA mimics and their inhibitors on the differentiation of CG-4 cells in RT-qPCR. This dot plot shows the fold change (FC) of the relative expression of the OPC marker (Id4) and OL markers (Myrf, Plp1, Mbp, and Mobp) as labeled on the y-axis, resulting from the sequential transfection of each microRNA mimic followed or not by its inhibitor in CG-4 cells in differentiation culture conditions. For each microRNA mimic, the fold change was calculated to the differentiation vehicle control (DIFF VehCo), while for each microRNA inhibitor, it was calculated to its corresponding microRNA mimic, as labeled on the x-axis. The color of each dot represents the fold change (expressed in logarithm base 2 [Log2(FC)]) of the relative expression, scaled by a blue-to-yellow color gradient from −2 to 1.3 (blue corresponding to a negative fold change, yellow to a positive), and its size represents the adjusted p-value (padj) (expressed as minus logarithm base 10 [−Log10(padj)]) as indicated in the plot legend. The adjusted p-value was calculated by Dunn’s or Dunnett’s multiple comparison test of each condition to the differentiation vehicle control and by Sidak’s, Tamhane’s T2, or Dunn’s multiple comparison test between the mimic and its inhibitor, as recommended following a parametric/non-parametric one-way ANOVA on all conditions, including the proliferation vehicle control (not shown). Only the significant data are depicted; thus, missing dots correspond to non-significant data. −Log10(padj) ≥1.3 corresponds to the significance level of p ≤ 0.05, −Log10(padj) of 2.0 corresponds to p = 0.01, −Log10(padj) of 3.0 to p = 0.001, and −Log10(padj) of 4.0 to p = 0.0001. Data were from three experiments for each microRNA with each condition in triplicate. OPC, oligodendrocyte progenitor cells; OL, oligodendrocytes. The corresponding bar plots showing both the statistically significant and non-significant results can be found in Supplementary Figure S4.

