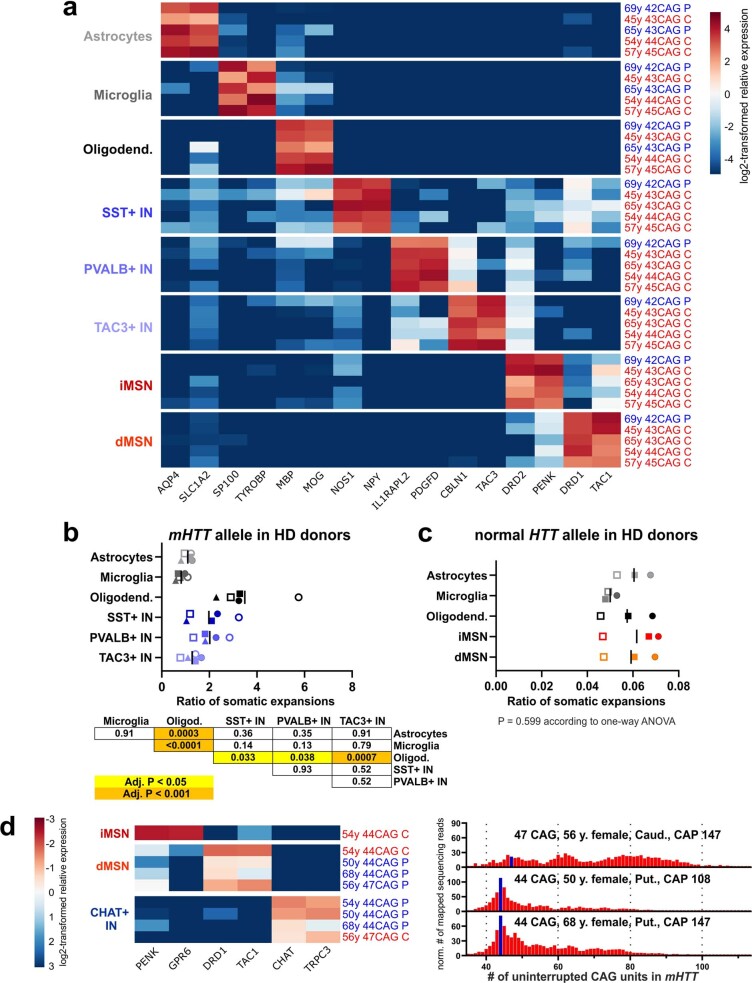
Extended Data Fig. 3. Further characterization of samples used for mHTT CAG repeat tract stability analysis.
a, Relative expression level of marker genes of striatal cell types in the nuclear transcriptome of nuclei collected for mHTT CAG repeat tract analysis. Heatmap depicts log2-transformed relative expression in each sample (calculated based on DESeq2-normalized counts). The striatal region of origin is indicated by colored letters (blue P, putamen; red C, caudate nucleus). b, Comparison of the calculated ratio of somatic expansions of mHTT CAG tract in striatal cell types other than MSNs (n = 5 individual donors). The table presents adjusted P-values as calculated by Holm–Sidak’s multiple comparisons test post one-way ANOVA (P < 0.0001). See also Supplementary Note 2. c, Ratio of somatic expansions of normal HTT allele CAG tract in striatal cell types isolated from n = 3 HD donors with 21-25 uninterrupted repeats in normal HTT allele. P = 0.599 according to one-way ANOVA. A different symbol is used for each donor. d, (Left) Relative expression level of MSN and CHAT + IN marker genes in the nuclear transcriptome of nuclei collected for mHTT CAG repeat tract analysis (for description see a). (Right) Length distribution of mHTT CAG tract in CHAT + IN samples. Blue bar marks sequencing reads derived from the initial unexpanded CAG tract. y axes denote normalized number of sequencing reads mapped to reference sequences with different CAG tract lengths (normalized by scaling to 1,000 reads). Reads derived from the normal HTT allele are not shown.

