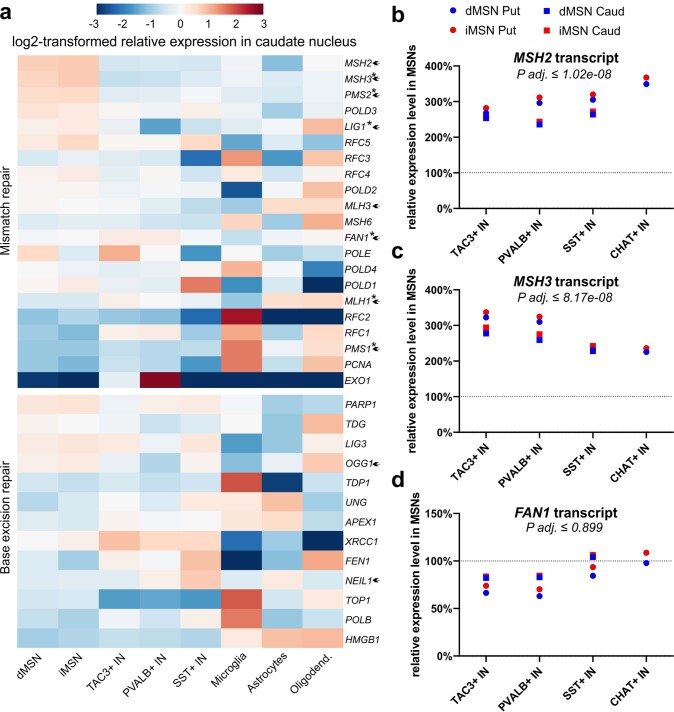
Extended Data Fig. 4. Relative expression level of MMR and BER genes in cell types of caudate nucleus.
a, Heatmaps depict log2-transformed relative expression in each cell type, calculated based on the mean of DESeq2-normalized counts from 7-8 control donors. Genes identified as HD age at onset-modifying candidates are marked with an asterisk. Genes known to influence CAG tract instability in HD mouse models are marked with an arrowhead. b-d, Relative levels of MSH2 (b), MSH3 (c) and FAN1 (d) transcripts in MSNs compared to interneurons, calculated with DESeq2 using cell type-specific FANS-seq data from control donors. The largest P adj. value of all MSN vs. interneuron comparisons (by DESeq2, P adjusted for multiple comparisons) is indicated for each gene. For caudate nucleus samples: n = 8 individuals for dMSNs, iMSNs, TAC3 + IN, PVALB + IN and SST + IN. For putamen samples: n = 8 individuals for dMSNs, iMSNs, TAC3 + IN, n = 7 individuals for PVALB + IN and n = 6 individuals for SST + IN.

