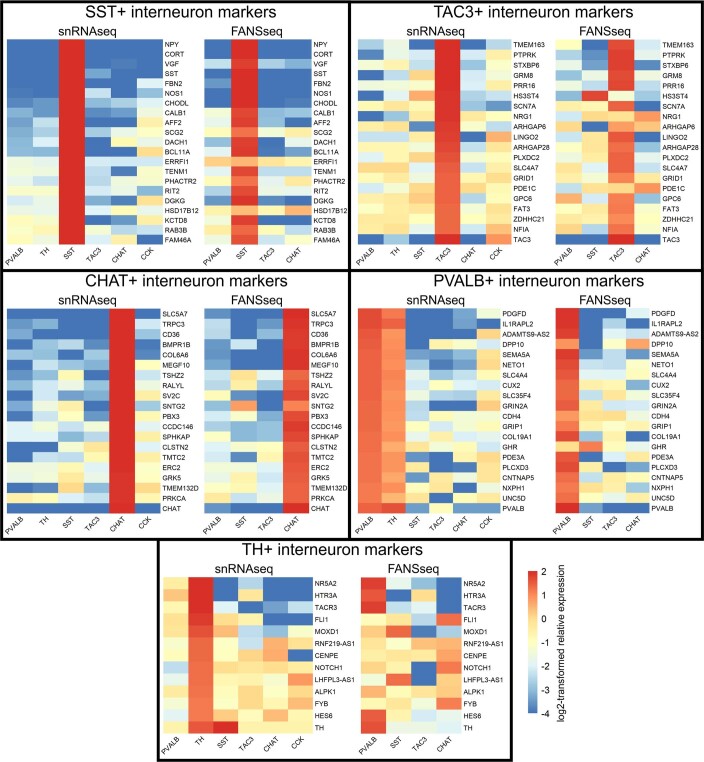
Extended Data Fig. 1. Comparison of interneuron populations collected using FANS to cell types defined from single-nucleus RNA sequencing of human striatum.
Relative expression in each cell type was calculated based on DESeq2-normalized counts from 6-8 control donors, and was log2-transformed for visualization (see Methods). The marker genes specific for each interneuron subtype were selected based on single-nucleus RNA sequencing (snRNA-seq) data19. The FANS-isolated ETV1 + TAC3- population of Parvalbumin-expressing interneuron nuclei most likely captured both the major PVALB+ interneuron population and the related smaller PVALB + TH+ interneuron population defined as a separate subtype in snRNA-seq analysis19.

