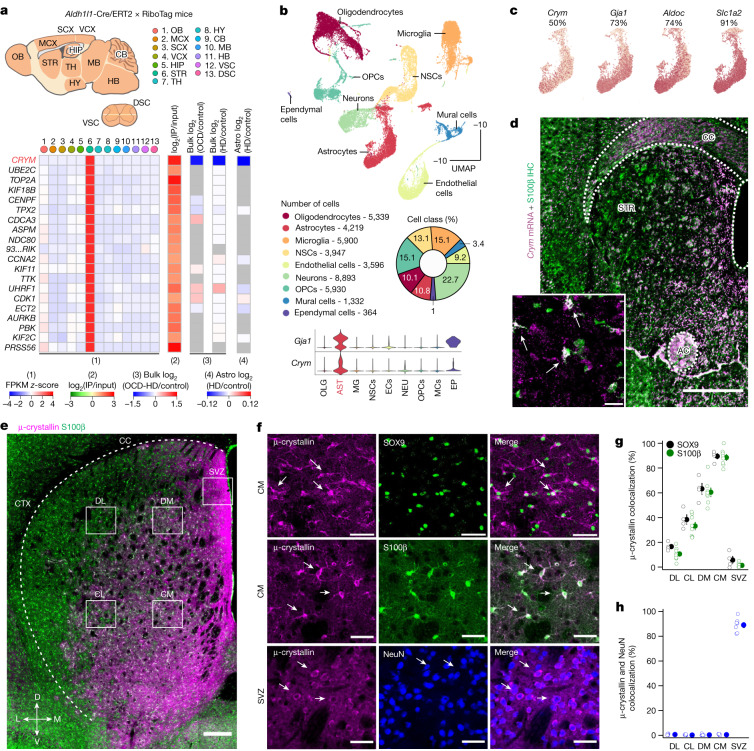
Fig. 1. A molecularly defined and allocated Crym+ population of striatal astrocytes.
a, Top 20 striatal-astrocyte-enriched genes from RNA-seq15 of 13 brain areas: OB, olfactory bulb; MCX, motor cortex; SCX, somatosensory cortex; VCX, visual cortex; HIP, hippocampus; STR, striatum; TH, thalamus; HY, hypothalamus; CB, cerebellum; MB, midbrain; HB, hindbrain; DSC, dorsal spinal cord; VSC, ventral spinal cord. The fragments per kilobase per million mapped fragments (FPKM) z-score shows the 20 striatal-astrocyte-enriched genes as compared with other areas and their enrichment (log2 immunoprecipitated (IP)/input). The orphan gene 9330182L06RiK has been abbreviated as 93...RiK in a. The other heat maps show the genes plotted from bulk RNA-seq data from human OCD5 and HD6 and in astrocytes from individuals with HD7 relative to control individuals. b, scRNA-seq of two-month-old striatum optimized for cellular diversity23, as seen in cell-class percentages. Uniform manifold approximation and projection (UMAP) of 39,156 cells from the striatum shows cell classes, including astrocytes. Violin plots show astrocyte enrichment of Gja1 and Crym (n = 4 mice). OLG, oligodendrocytes; AST, astrocytes; MG, microglia; NSCs, neural stem cells; ECs, endothelial cells; NEU, neurons; OPCs, oligodendrocyte precursor cells; MCs, mural cells; EP, ependymal cells. c, Crym was expressed in around 50% of astrocytes; astrocytic markers were found in more. d, Crym mRNA expression along with S100β IHC; inset higher magnification (representative of n = 16 sections from 4 mice). Scale bars, 500 μm (main); 20 μm (inset). CC, corpus callosum. AC, anterior commissure. e, Images of µ-crystallin (magenta) and astrocytic S100β (green) IHC. µ-crystallin shows a dorsoventral and lateromedial spatial gradient (CTX, cortex; SVZ, subventricular zone; DL, dorsolateral striatum; DM, dorsomedial striatum; CL, centrolateral striatum; CM, centromedial striatum). Scale bar, 200 μm. f, Magnified images of µ-crystallin (magenta) and SOX9 (green), and μ-crystallin and S100β (green) IHC in the centromedial striatum (CM). μ-crystallin and NeuN IHC in the SVZ are also shown. Scale bars, 40 μm. g,h, Percentage of astrocytes (g; S100β+ and SOX9+) and neurons (h; NeuN+) expressing µ-crystallin (n = 4, 8 and 7 mice for SOX9, S100β and NeuN, respectively). The white arrows in panels d and f point to instances of co-localization in the images. Average data shown as mean ± s.e.m. and all statistics reported in Supplementary Table 5.

