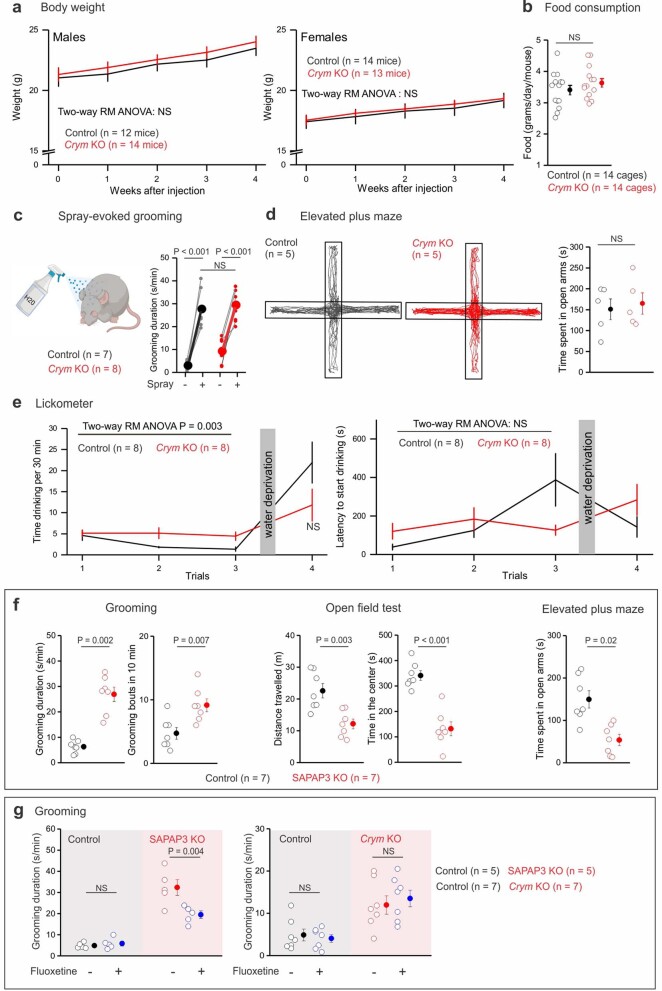
Extended Data Fig. 5. Additional behaviours and comparison with SAPAP3−/− mice.
a, Body weight of males (left) and females (right) before and after AAV injection for 4 weeks (two-way repeated-measures ANOVA followed by Tukey’s post-hoc test). b, Scatter graph shows the home cage food consumption in control and Crym KO mice (n = 14 cages with more than 2 mice per cage; two-sample t-test). c, Schematic and graph show grooming duration evoked by spraying the mice with water for control and Crym KO mice (n = 7 control mice and n = 8 Crym KO mice; two-way repeated-measures ANOVA followed by Tukey’s post-hoc test, P = 8.9 x 10⁻⁸). d, Representative 20 min elevated plus maze recording for control and Crym KO mice. Scatter graph shows the time spent in open arms for control and Crym KO mice (n = 5 mice; two-tailed two-sample t-test). e, Scatter graphs show the time drinking and the latency to start drinking over 30 minutes for each trial completed for 4 days (n = 8 mice; two-way repeated-measures ANOVA followed by Tukey’s post-hoc test). f, Scatter graphs show self-grooming duration, grooming bouts, distance travelled, time spent in the centre, and time spent in the open arms in control and SAPAP3 KO mice (n = 7 mice; two-tailed Mann–Whitney test or two-tailed two-sample t-test, P = 4 x 10⁻⁵ for the time in the centre). g, Scatter graphs show self-grooming duration after fluoxetine treatment (blue) in control and SAPAP3 KO mice (left; n = 5 mice; two-way repeated-measures ANOVA followed by Tukey’s post-hoc test) and in control and Crym KO mice (right; n = 7 mice; two-way repeated-measures ANOVA followed by Tukey’s post-hoc test). Average data are shown as mean ± s.e.m.and all statistics are reported in Supplementary Table 5.

