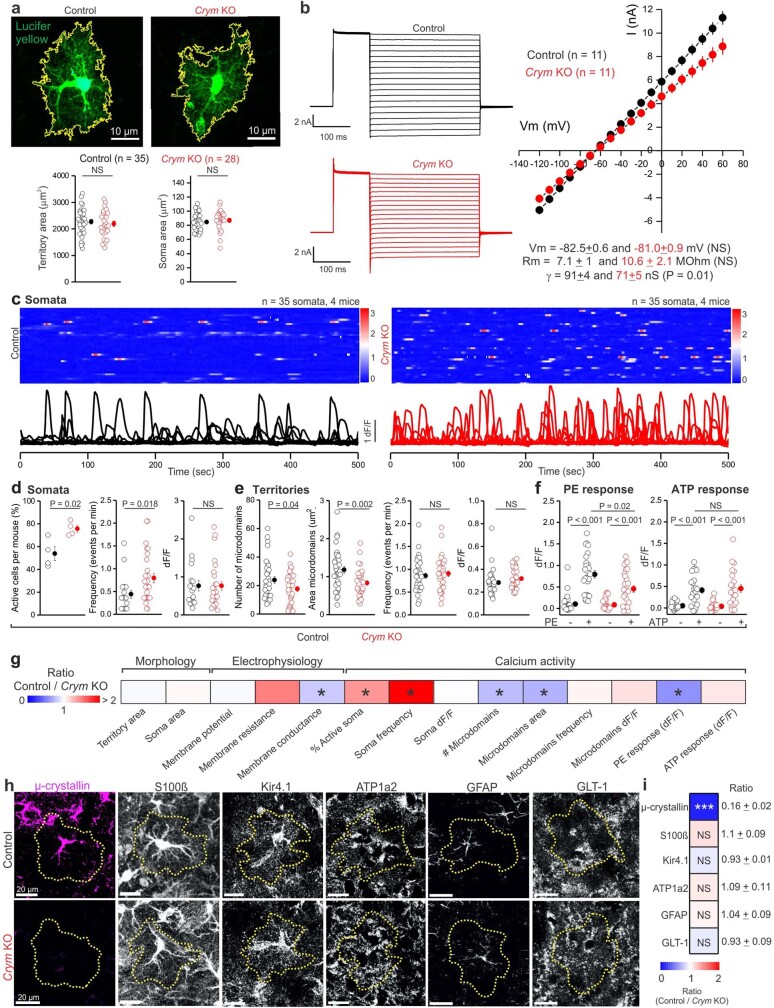
Extended Data Fig. 7. Functional characterization of control and Crym KO astrocytes.
a, Representative images for control and Crym KO striatal astrocytes filled with Lucifer yellow by iontophoresis. Bottom scatter graphs show the territory area (left) and soma area (right) (n = 35 cells for control and n = 28 cells for Crym KO from 4 mice, two-tailed Mann–Whitney test or two-tailed two-sample t-test). b, Whole-cell voltage clamp performed in control and Crym KO striatal astrocytes. Representative currents waveforms, average current-voltage relationships, membrane potential (mV), membrane resistance (MOhm) and slope conductance (nS) are shown (n = 11 cells from 4 mice, two-tailed two-sample t-test and two tailed Mann-Whitney test). c, Kymographs and traces representing the ΔF/F of Ca2+ signals in astrocyte somata. d, Scatter graphs show the percent of active cells per mouse (n = 4 mice, two-tailed two-sample t-test), frequency, and ΔF/F in somata (n = 35 cells from 4 mice, two-tailed Mann–Whitney tests). e, Scatter graphs show the number, area, frequency, and ΔF/F of calcium signals in the astrocyte territories (n = 35 cells from 4 mice, two-tailed Mann–Whitney test or two-tailed two-sample t-test). f, Scatter graphs of Ca2+ signals, represented by ΔF/F, evoked by 10 µm phenylephrine (PE; n = 26 cells from 4 mice) (left) or by 100 µm ATP (right; n = 23 cells from 4 mice) in control and Crym KO astrocytes (Two-way ANOVAs followed by Tukey’s post-hoc test, ANOVA p-value overall genotype = 7.6 ×10⁻³ for PE and 8.4 x 10⁻¹ for ATP). g, Heat map summarizes the ratio of metrics from control vs Crym KO of all parameters assessed (* = P < 0.05). Statistical tests and P values for the heat map are from the corresponding data reported in the earlier panels in the figure. h,i, Marker expression in control and Crym KO astrocytes. Representative images (h) and ratios (i) for the expression of the various canonical astrocyte markers indicated. μ-crystallin was significantly reduced, but the other markers were not. The heat map shows the ratio of control vs Crym KO (n = 30 cells from 5 mice for µ-crystallin, S100ß, Kir4.1, GLT1 and n = 24 cells from 5 mice for ATP1a2, GFAP; Mann–Whitney test or two-sample t-test, *** P = 3 × 10⁻¹¹, NS = non-significant). Average data are shown as mean ± s.e.m. and all statistics are reported in Supplementary Table 5.

