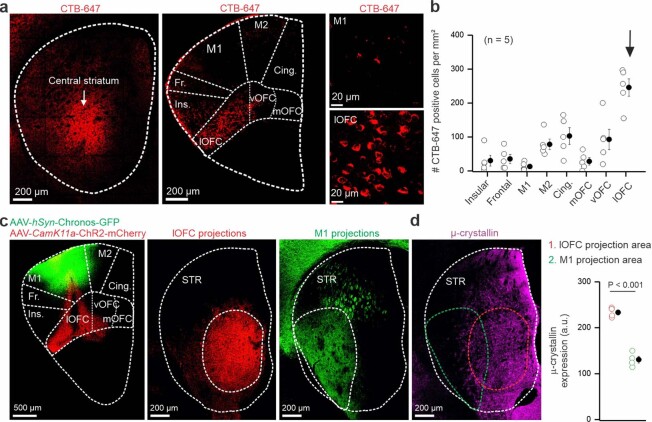
Extended Data Fig. 8. Retrograde and anterograde evaluations of major cortical projections to the central striatum, in which Crym+ astrocytes are abundant.
a, Representative images show retrograde labelling using Alexa 647-conjugated cholera toxin subunit B (CTB-647). Left image shows the CTB-647 injection site in the central striatum (white arrow). Central image shows CTB-647 labelled neurons in different part of the cortex (M1, motor cortex 1; M2, motor cortex 2; Cing., cingulate cortex; Fr., frontal cortex; Ins., insular cortex; OFC, orbitofrontal cortex medial (m), ventral (v) or lateral (l)). Right images show CTB-647 labelled neurons in M1 and lOFC. b, Scatter graph of the number of CTB-647 positive neurons in different parts of the cortex (n = 5 mice). c, AAV1-hSyn-Chronos-GFP and AAV9-CamK11a-ChR2-mCherry were injected into M1 and lOFC to label the projections in the striatum. Images show lOFC and M1 projections in the striatum. d, Image and scatter graph show µ-crystallin expression in the M1 and lOFC projection area (n = 4 mice; two-tailed two-sample t-test, P = 3.2 x 10⁻⁵). Average data are shown as mean ± s.e.m. and all statistics are reported in Supplementary Table 5.

