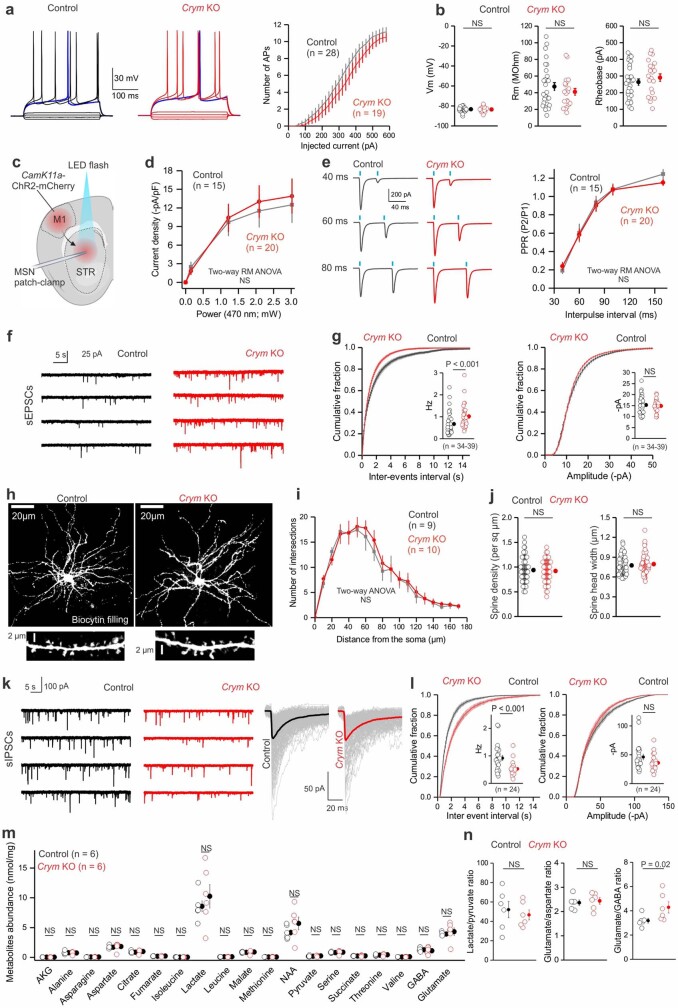
Extended Data Fig. 9. Further MSN properties in Crym KO mice.
a, Traces of MSN membrane responses to current injection (left) and relationship of injected current to number of APs (right) in control and Crym KO mice. b, Scatter graphs show the MSN resting membrane potential, membrane resistance, and rheobase in control (n = 28 cells from 11 mice) and Crym KO mice (n = 19 cells from 11 mice; two-tailed Mann–Whitney test or -two-tailed two-sample t-test). c, Cartoon of AAV2-CamK11a-ChR2-mCherry injection into the M1. Recordings were done in the central striatum. d, Graph shows the current density after brief pulses of 470 nm light (2 ms) at different power in control (n = 15 cells from 5 mice) and Crym KO (n = 20 cells from 5 mice; two-way repeated measure ANOVA). e, Representative traces and graph for evoked EPSCs due to paired stimuli in control (n = 15 cells from 5 mice) and Crym KO mice (n = 20 cells from 5 mice; two-way repeated measure ANOVA). f, Representative sEPSC traces from one individual representative MSN from control and Crym KO mice. g, Cumulative probability graph for the inter-event interval (left) and for the amplitude (right). Pooled data for the frequency and amplitude are shown in the inset bar graph (n = 39 cells from 16 mice for control and n = 34 cells from 14 mice for Crym KO, two-tailed Mann–Whitney t-tests, P = 2.8 x 10⁻⁴). h, Images of biocytin-labelled MSNs and dendritic spines in control (left) and Crym KO (right) mice. i, Sholl analyses performed with increments of 10 μm diameter (n = 9 MSNs in control and n = 10 MSNs in Crym KO from 5 mice; two-way repeated measure ANOVA). j, Scatter graphs show spine density and spin head width in control (n = 74 dendrites from 10 MSNs from 5 mice) and Crym KO mice (n = 86 dendrites from 11 MSNs from 5 mice; two-tailed two-sample t-test and two-tailed Mann–Whitney test). k, Representative sIPSC current traces (left) and individual traces and average (right) from one representative MSN from control and Crym KO mice. l, Cumulative probability graph for the inter-event interval (left) and for the amplitude (right). Pooled data for the frequency and amplitude are shown in the inset bar graph (n = 24 cells from 5 mice, two-tailed Mann–Whitney tests, P = 9.3 ×10⁻⁴). m, Scatter graph of 17 metabolites and 2 neurotransmitters (GABA and glutamate) measured by mass spectrometry (n = 6 mice; two-tailed Mann–Whitney test or two-tailed two-sample t-test; AKG as alpha-ketoglutarate and NAA as N-acetyl-aspartate). n, Scatter graphs show lactate/pyruvate, glutamate/aspartate, and glutamate/GABA ratio in control and Crym KO mice (n = 6 mice; two-tailed Mann–Whitney test or two-tailed two-sample t-test). Average data are shown as mean ± s.e.m. and all statistics are reported in Supplementary Table 5.

