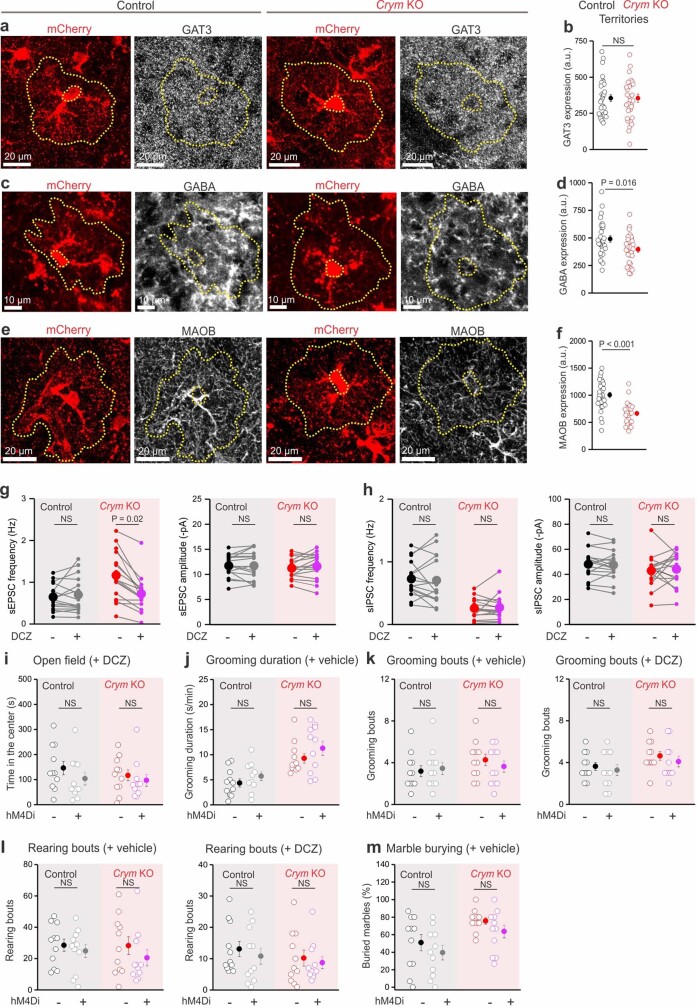
Extended Data Fig. 10. Assessments of GAT3, GABA and MAOB in control and Crym KO astrocytes, and supportive data for presynaptic chemogenetics.
a–f, Representative images and quantification of the expression of GAT3 (a,b), GABA (c,d) and MAOB (e,f) in control (left) and Crym KO astrocytes (right) (n = 30 cells from 6 mice for GABA and MAOB, n = 32 cells from 6 mice for GAT3; two-tailed Mann–Whitney test or two-tailed two-sample t-test, P = 6.5 × 10⁻⁸ for MAOB). g–m, Presynaptic chemogenetics supportive data. g, Graphs show the sEPSC frequency (left) and amplitude (right) of control and Crym KO mice before and after 200 nM DCZ application (n = 16 cells from 4 mice, two-tailed paired-sample t-test and two-tailed paired sign test). h, As in g, but for sIPSC (n = 16 cells from 4 mice, two-tailed paired-sample t-test and two-tailed paired sign test). i–m, Graphs show the time in the centre (i), grooming duration (j), grooming bouts (k), rearing bouts (l) and % of buried marbles (m) of control and Crym KO mice with or without rg-h4DMi after DCZ or vehicle treatment (n = 11 mice per group; two-way ANOVA followed by Tukey’s post-hoc test). Average data are shown as mean ± s.e.m. and all statistics are reported in Supplementary Table 5.

