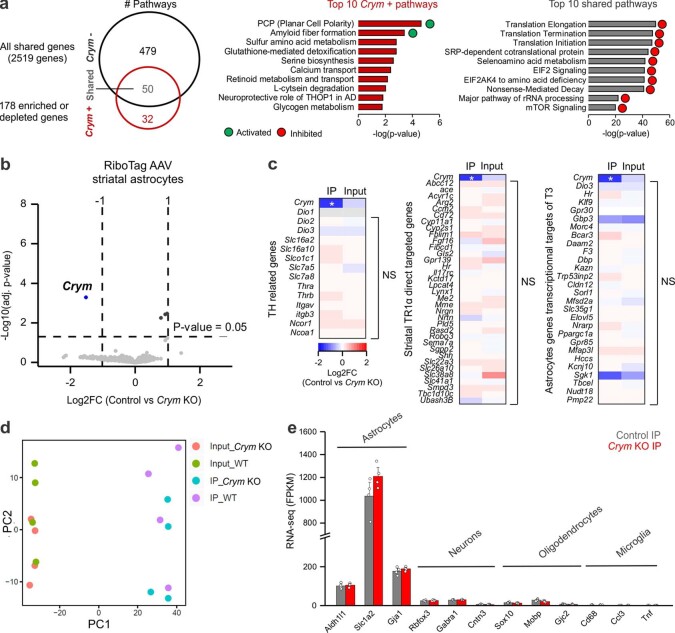
Extended Data Fig. 11. Molecular mechanisms of µ-crystallin in striatal astrocytes and supplementary data for RNA-seq.
a, Unique and common pathways for the 2,519 shared genes versus the 178 enriched and depleted genes in the Crym+ population. Top 10 shared pathways for the Crym+ astrocytes versus other striatal astrocytes (grey) and top 10 unique pathways for Crym+ astrocytes (red) are shown. b, Volcano plot of differentially expressed genes (DEGs) (limmaVoom, FDR < 0.05) shows the numbers of up- and downregulated astrocyte genes between Crym KO IP and control IP. These analyses were restricted to genes with >2-fold enrichment in the IP compared with the input. Only Crym was found significantly downregulated. c, Heat maps of Log2FC for TH related genes, striatal TR1αdirectly targeted genes, and astrocytic transcriptional targets of T3 (* P = 5.1 x 10⁻⁴; NS, not significant). (d) Striatal astrocyte principal component (PCA) analysis of the 500 most variable genes across 8 samples. e, Gene-expression levels (in fragments per kilobase per million, FPKM) of cell-specific markers for astrocytes, neurons, oligodendrocytes, and microglia after a local injection of astrocyte-selective RiboTag AAV in the central striatum (IP samples) (n = 4 mice). Average data are shown as mean ± s.e.m. and all statistics are reported in Supplementary Table 3.

